<< Chapter < Page Chapter >> Page >

Motions of two stars orbiting each other and what the spectrum shows.

Motions of Two Stars Orbiting Each Other and What the Spectrum Shows. This figure has four binary star spectra, each with blue wavelengths on the left and red wavelengths on the right. Above each spectrum is a diagram showing the orbit of the two binary stars. Spectrum 1 has two spectral lines, one from each star. The lines for star B is roughly in the center of the spectrum, and the line for star A is a little to the left. The orbit shows the stars at opposite sides horizontally, with an arrow pointing down from star A and an arrow pointing up from star B, indicating that the stars are moving horizontally to our line of sight. In spectrum 2, both lines merge into one and the line is labeled “A + B”. The orbit shows the stars at opposite sides horizontally, with an arrow pointing right from star A and an arrow pointing left from star B, indicating that the stars are moving perpendicularly to our line of sight. In spectrum 3 the line for star B is near the center and that of star A is on the right. The orbit shows the stars at opposite sides horizontally, with an arrow pointing up from star A and an arrow pointing down from star B, indicating that the stars are moving horizontally to our line of sight. Finally, in spectrum 4, the lines have again merged near the center and the line is labeled “B + A”. The orbit shows the stars at opposite sides horizontally, with an arrow pointing left from star A and an arrow pointing right from star B, indicating that the stars are moving perpendicularly to our line of sight.
We see changes in velocity because when one star is moving toward Earth, the other is moving away; half a cycle later, the situation is reversed. Doppler shifts cause the spectral lines to move back and forth. In diagrams 1 and 3, lines from both stars can be seen well separated from each other. When the two stars are moving perpendicular to our line of sight (that is, they are not moving either toward or away from us), the two lines are exactly superimposed, and so in diagrams 2 and 4, we see only a single spectral line. Note that in the diagrams, the orbit of the star pair is tipped slightly with respect to the viewer (or if the viewer were looking at it in the sky, the orbit would be tilted with respect to the viewer’s line of sight). If the orbit were exactly in the plane of the page or screen (or the sky), then it would look nearly circular, but we would see no change in radial velocity (no part of the motion would be toward us or away from us.) If the orbit were perpendicular to the plane of the page or screen, then the stars would appear to move back and forth in a straight line, and we would see the largest-possible radial velocity variations.

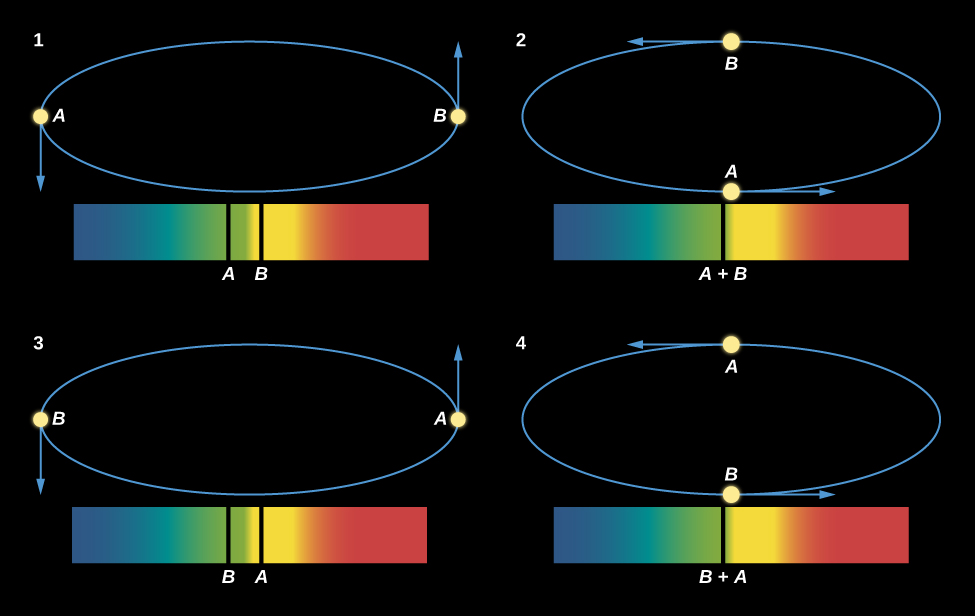
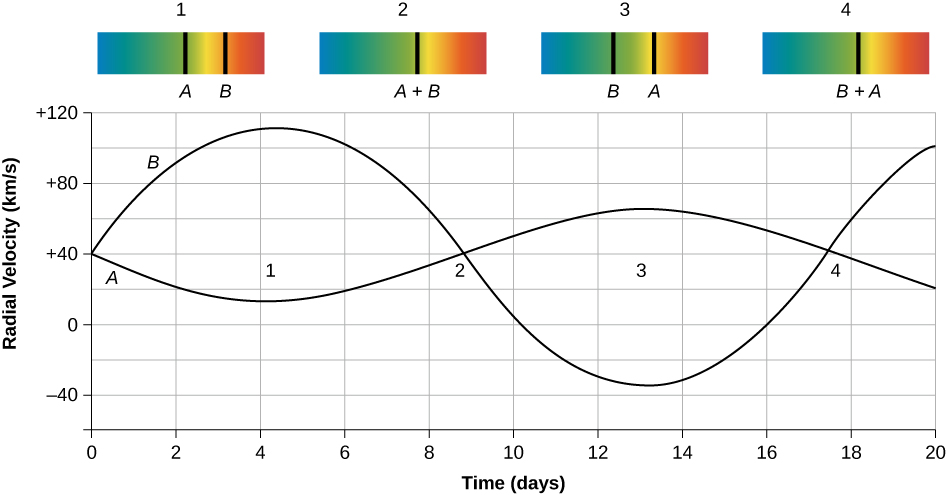
A plot showing how the velocities of the stars change with time is called a radial velocity curve ; the curve for the binary system in [link] is shown in [link] .

Radial velocities in a spectroscopic binary system.

Radial Velocities in a Spectroscopic Binary System. The upper portion of this figure has four binary star spectra, each with blue wavelengths on the left and red wavelengths on the right. Spectrum 1 at left has two spectral lines, one from each star. The line for star A is near the center and that for star B is toward the right. In spectrum 2, both lines merge into one and is labeled “A + B”. In spectrum 3 the line for star B is near the center and that of star A is on the right. Finally, in spectrum 4, the lines have again merged near the center and labeled “B + A”. The bottom portion shows a graph of measured radial velocities vs. time. The vertical axis is labeled “Radial Velocity (km/s)”, in 40 km/s increments. The horizontal axis is labeled “Time (days)”, in 2 day increments. Curves are plotted corresponding to the motion of stars A and B that are shown in the spectra above the plot. Both curves begin at day zero on the left at +40 km/s. At day 4, corresponding to spectrum 1, star A has a velocity of +15 km/s and B +110 km/s. At day 9 for spectrum 2, both stars are at +40 km/s. At day 13 (spectrum 3) star A is near +65 km/s and star B near -30 km/s. Finally, near day 17 (spectrum 4), both stars are again at +40 km/s.
These curves plot the radial velocities of two stars in a spectroscopic binary system, showing how the stars alternately approach and recede from Earth. Note that positive velocity means the star is moving away from us relative to the center of mass of the system, which in this case is 40 kilometers per second. Negative velocity means the star is moving toward us relative to the center of mass. The positions on the curve corresponding to the illustrations in [link] are marked with the diagram number (1–4).

Masses from the orbits of binary stars

We can estimate the masses of binary star systems using Newton’s reformulation of Kepler’s third law (discussed in Newton’s Universal Law of Gravitation ). Kepler found that the time a planet takes to go around the Sun is related by a specific mathematical formula to its distance from the Sun. In our binary star situation, if two objects are in mutual revolution, then the period ( P ) with which they go around each other is related to the semimajor axis ( D ) of the orbit of one with respect to the other, according to this equation

D 3 = ( M 1 + M 2 ) P 2

where D is in astronomical units, P is measured in years, and M 1 + M 2 is the sum of the masses of the two stars in units of the Sun’s mass. This is a very useful formula for astronomers; it says that if we can observe the size of the orbit and the period of mutual revolution of the stars in a binary system, we can calculate the sum of their masses.

Most spectroscopic binaries have periods ranging from a few days to a few months, with separations of usually less than 1 AU between their member stars. Recall that an AU is the distance from Earth to the Sun, so this is a small separation and very hard to see at the distances of stars. This is why many of these systems are known to be double only through careful study of their spectra.

Practice Key Terms 5

Get Jobilize Job Search Mobile App in your pocket Now!

Get it on Google Play Download on the App Store Now


Source:  OpenStax, Astronomy. OpenStax CNX. Apr 12, 2017 Download for free at http://cnx.org/content/col11992/1.13
Google Play and the Google Play logo are trademarks of Google Inc.

Notification Switch

Would you like to follow the 'Astronomy' conversation and receive update notifications?

Ask