<< Chapter < Page Chapter >> Page >

Intramembranous ossification

Image A shows seven osteoblasts, cells with small, finger like projections. They are surrounded by granules of osteoid. Both the cells and the osteoid are contained within a blue, circular, ossification center that is surrounded by a “socket” of dark, string-like collagen fibers and gray mesenchymal cells. The cells are generally amorphous, similar in appearance to an amoeba. In image B, the ossification center is no longer surrounded by a ring of osteoblasts. The osteoblasts have secreted bone into the ossification center, creating a new bone matrix. There are also five osteocytes embedded in the new bone matrix. The osteocytes are thin, oval-shaped cells with many fingerlike projections. Osteoid particles are still embedded in the bony matrix in image B.  In image C, the ring of osteoblasts surrounding the ossification center has separated, forming an upper and lower layer of osteoblasts sandwiched between the two layers of mesenchyme cells. A label indicates that the mesenchyme cells and the surrounding collagen fibers form the periosteum. The osteoblasts secrete spongy bone into the space between the two osteoblast rows. Therefore, the accumulating spongy bone pushes the upper and lower rows of osteoblasts away from each other. In this image, most of the spongy bone has been secreted by the osteoblasts, as the trabeculae are visible. In addition, an artery has already broken through the periosteum and invaded the spongy bone. Image D looks similar to image C, except that the rows of osteoblasts are now secreting layers of compact bone between the spongy bone and the periosteum. The artery has now branched and spread throughout the spongy bone. A label indicates that the cavities between the trabeculae now contain red bone marrow.
Intramembranous ossification follows four steps. (a) Mesenchymal cells group into clusters, and ossification centers form. (b) Secreted osteoid traps osteoblasts, which then become osteocytes. (c) Trabecular matrix and periosteum form. (d) Compact bone develops superficial to the trabecular bone, and crowded blood vessels condense into red marrow.

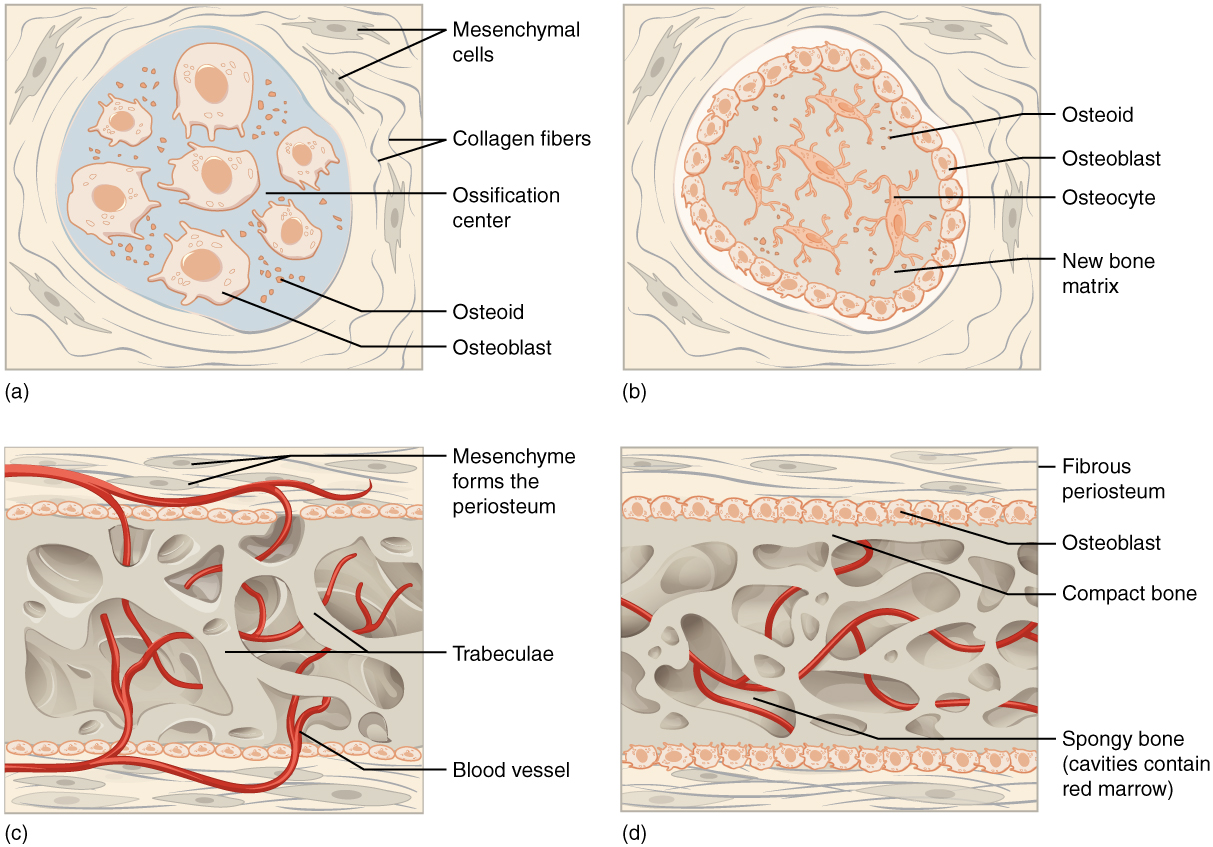
Intramembranous ossification begins in utero during fetal development and continues on into adolescence. At birth, the skull and clavicles are not fully ossified nor are the sutures of the skull closed. This allows the skull and shoulders to deform during passage through the birth canal. The last bones to ossify via intramembranous ossification are the flat bones of the face, which reach their adult size at the end of the adolescent growth spurt.

Endochondral ossification

In endochondral ossification    , bone develops by replacing hyaline cartilage. Cartilage does not become bone. Instead, cartilage serves as a template to be completely replaced by new bone. Endochondral ossification takes much longer than intramembranous ossification. Bones at the base of the skull and long bones form via endochondral ossification.

In a long bone, for example, at about 6 to 8 weeks after conception, some of the mesenchymal cells differentiate into chondrocytes (cartilage cells) that form the cartilaginous skeletal precursor of the bones ( [link] a ). Soon after, the perichondrium    , a membrane that covers the cartilage, appears [link] b ).

Endochondral ossification

Image A shows a small piece of hyaline cartilage that looks like a bone but without the characteristic enlarged ends. The hyaline cartilage is surrounded by a thin perichondrium. In image B, the hyaline cartilage has increased in size and the ends have begun to bulge outwards. A group of dark granules form at the center of the cartilage. This is labeled the calcified matrix, as opposed to the rest of the cartilage, which is uncalcified matrix. In image C, the hyaline cartilage has again increased in size and spongy bone has formed at the calcified matrix. This is now called the primary ossification center. A nutrient artery has invaded the ossification center and is growing through the cavities of the new spongy bone. In image D, the cartilage now looks like a bone, as it has greatly increased in size and each end has two bulges. Only the proximal half of the bone is shown in all of the remaining images. In image D, spongy bone has completely developed in the medullary cavity, which is surrounded, on both sides, by compact bone. Now, the calcified matrix is located at the border between the proximal metaphysis and the proximal epiphysis. The epiphysis is still composed of uncalcified matrix. In image E, arteries and veins have now invaded the epiphysis, forming a calcified matrix at its center. This is called a secondary ossification center. In image F, the interior of the epiphysis is now completely calcified into bone. The outer edge of the epiphysis remains as cartilage, forming the articular cartilage at the joint. In addition, the border between the epiphysis and the metaphysis remains uncalcified, forming the epiphyseal plate.
Endochondral ossification follows five steps. (a) Mesenchymal cells differentiate into chondrocytes. (b) The cartilage model of the future bony skeleton and the perichondrium form. (c) Capillaries penetrate cartilage. Perichondrium transforms into periosteum. Periosteal collar develops. Primary ossification center develops. (d) Cartilage and chondrocytes continue to grow at ends of the bone. (e) Secondary ossification centers develop. (f) Cartilage remains at epiphyseal (growth) plate and at joint surface as articular cartilage.

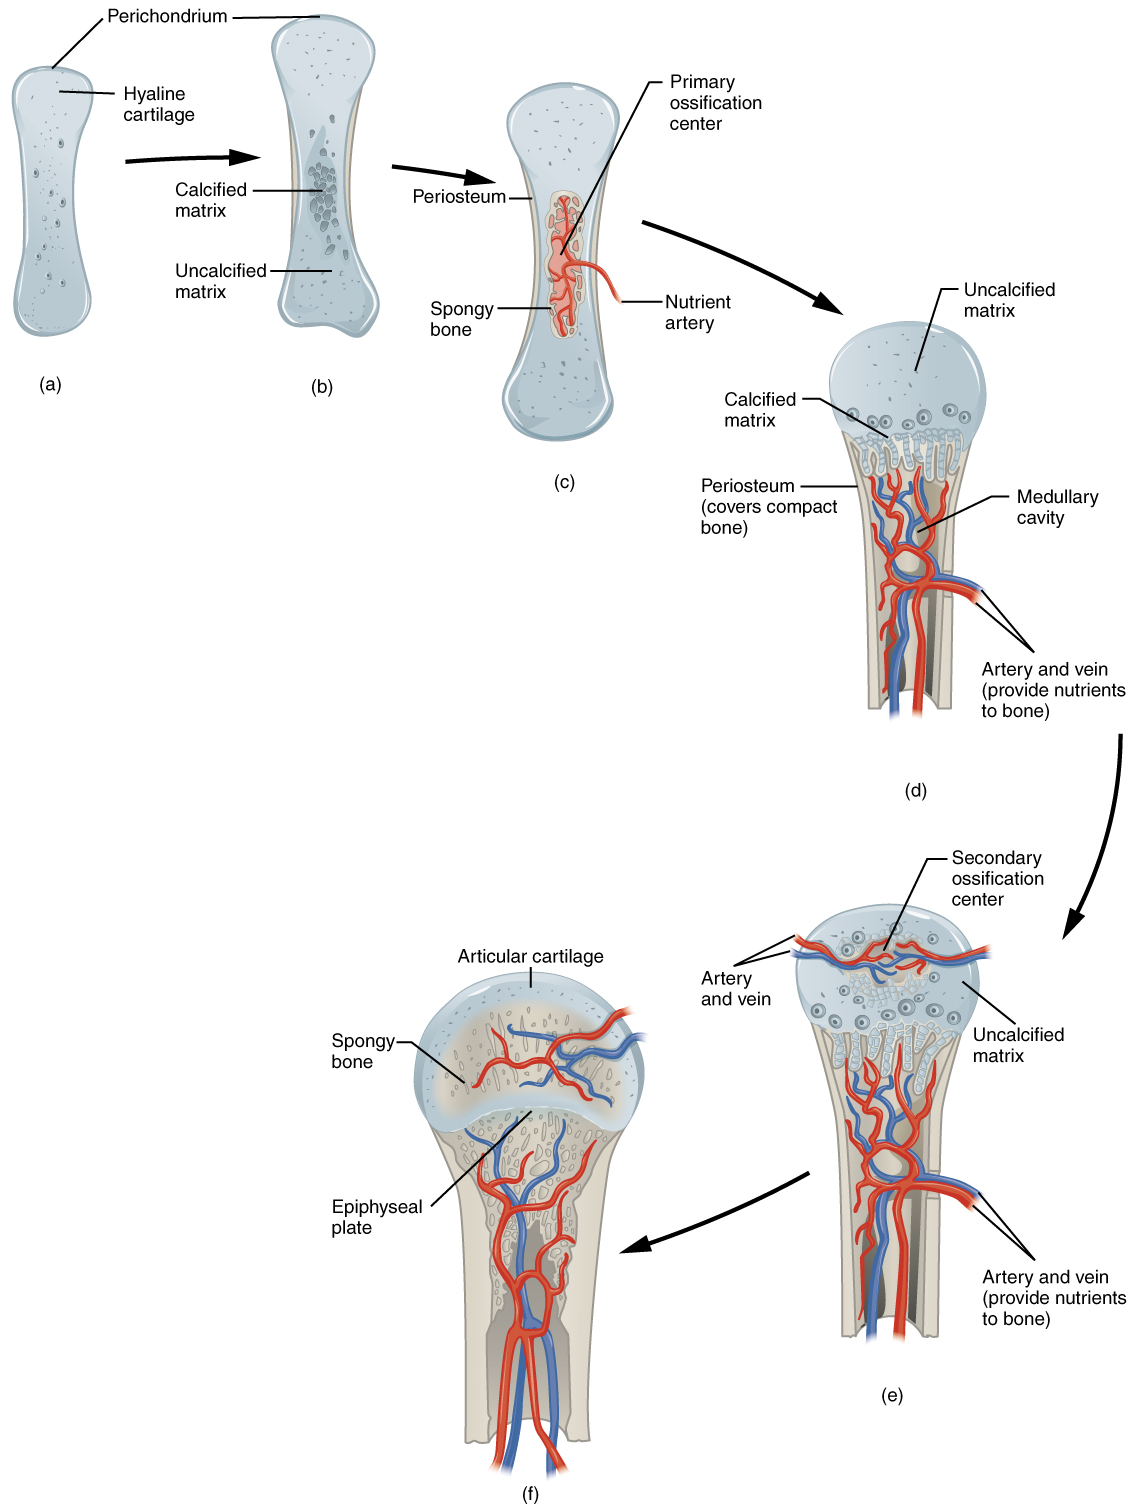
As more matrix is produced, the chondrocytes in the center of the cartilaginous model grow in size. As the matrix calcifies, nutrients can no longer reach the chondrocytes. This results in their death and the disintegration of the surrounding cartilage. Blood vessels invade the resulting spaces, not only enlarging the cavities but also carrying osteogenic cells with them, many of which will become osteoblasts. These enlarging spaces eventually combine to become the medullary cavity.

As the cartilage grows, capillaries penetrate it. This penetration initiates the transformation of the perichondrium into the bone-producing periosteum. Here, the osteoblasts form a periosteal collar of compact bone around the cartilage of the diaphysis. By the second or third month of fetal life, bone cell development and ossification ramps up and creates the primary ossification center    , a region deep in the periosteal collar where ossification begins ( [link] c ).

While these deep changes are occurring, chondrocytes and cartilage continue to grow at the ends of the bone (the future epiphyses), which increases the bone’s length at the same time bone is replacing cartilage in the diaphyses. By the time the fetal skeleton is fully formed, cartilage only remains at the joint surface as articular cartilage and between the diaphysis and epiphysis as the epiphyseal plate, the latter of which is responsible for the longitudinal growth of bones. After birth, this same sequence of events (matrix mineralization, death of chondrocytes, invasion of blood vessels from the periosteum, and seeding with osteogenic cells that become osteoblasts) occurs in the epiphyseal regions, and each of these centers of activity is referred to as a secondary ossification center    ( [link] e ).

Questions & Answers

What are the factors that affect demand for a commodity
Florence Reply
differentiate between demand and supply giving examples
Lambiv Reply
differentiated between demand and supply using examples
Lambiv
what is labour ?
Lambiv
how will I do?
Venny Reply
how is the graph works?I don't fully understand
Rezat Reply
information
Eliyee
devaluation
Eliyee
t
WARKISA
hi guys good evening to all
Lambiv
multiple choice question
Aster Reply
appreciation
Eliyee
explain perfect market
Lindiwe Reply
In economics, a perfect market refers to a theoretical construct where all participants have perfect information, goods are homogenous, there are no barriers to entry or exit, and prices are determined solely by supply and demand. It's an idealized model used for analysis,
Ezea
What is ceteris paribus?
Shukri Reply
other things being equal
AI-Robot
When MP₁ becomes negative, TP start to decline. Extuples Suppose that the short-run production function of certain cut-flower firm is given by: Q=4KL-0.6K2 - 0.112 • Where is quantity of cut flower produced, I is labour input and K is fixed capital input (K-5). Determine the average product of lab
Kelo
Extuples Suppose that the short-run production function of certain cut-flower firm is given by: Q=4KL-0.6K2 - 0.112 • Where is quantity of cut flower produced, I is labour input and K is fixed capital input (K-5). Determine the average product of labour (APL) and marginal product of labour (MPL)
Kelo
yes,thank you
Shukri
Can I ask you other question?
Shukri
what is monopoly mean?
Habtamu Reply
What is different between quantity demand and demand?
Shukri Reply
Quantity demanded refers to the specific amount of a good or service that consumers are willing and able to purchase at a give price and within a specific time period. Demand, on the other hand, is a broader concept that encompasses the entire relationship between price and quantity demanded
Ezea
ok
Shukri
how do you save a country economic situation when it's falling apart
Lilia Reply
what is the difference between economic growth and development
Fiker Reply
Economic growth as an increase in the production and consumption of goods and services within an economy.but Economic development as a broader concept that encompasses not only economic growth but also social & human well being.
Shukri
production function means
Jabir
What do you think is more important to focus on when considering inequality ?
Abdisa Reply
any question about economics?
Awais Reply
sir...I just want to ask one question... Define the term contract curve? if you are free please help me to find this answer 🙏
Asui
it is a curve that we get after connecting the pareto optimal combinations of two consumers after their mutually beneficial trade offs
Awais
thank you so much 👍 sir
Asui
In economics, the contract curve refers to the set of points in an Edgeworth box diagram where both parties involved in a trade cannot be made better off without making one of them worse off. It represents the Pareto efficient allocations of goods between two individuals or entities, where neither p
Cornelius
In economics, the contract curve refers to the set of points in an Edgeworth box diagram where both parties involved in a trade cannot be made better off without making one of them worse off. It represents the Pareto efficient allocations of goods between two individuals or entities,
Cornelius
Suppose a consumer consuming two commodities X and Y has The following utility function u=X0.4 Y0.6. If the price of the X and Y are 2 and 3 respectively and income Constraint is birr 50. A,Calculate quantities of x and y which maximize utility. B,Calculate value of Lagrange multiplier. C,Calculate quantities of X and Y consumed with a given price. D,alculate optimum level of output .
Feyisa Reply
Answer
Feyisa
c
Jabir
the market for lemon has 10 potential consumers, each having an individual demand curve p=101-10Qi, where p is price in dollar's per cup and Qi is the number of cups demanded per week by the i th consumer.Find the market demand curve using algebra. Draw an individual demand curve and the market dema
Gsbwnw Reply
suppose the production function is given by ( L, K)=L¼K¾.assuming capital is fixed find APL and MPL. consider the following short run production function:Q=6L²-0.4L³ a) find the value of L that maximizes output b)find the value of L that maximizes marginal product
Abdureman
Got questions? Join the online conversation and get instant answers!
Jobilize.com Reply

Get Jobilize Job Search Mobile App in your pocket Now!

Get it on Google Play Download on the App Store Now


Source:  OpenStax, Anatomy & Physiology. OpenStax CNX. Feb 04, 2016 Download for free at http://legacy.cnx.org/content/col11496/1.8
Google Play and the Google Play logo are trademarks of Google Inc.

Notification Switch

Would you like to follow the 'Anatomy & Physiology' conversation and receive update notifications?

Ask