| << Chapter < Page | Chapter >> Page > |
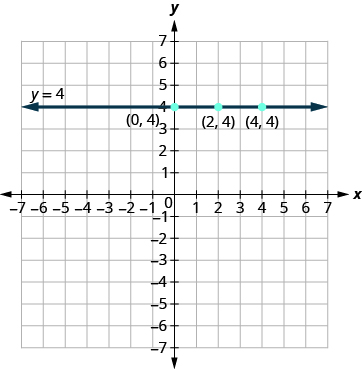
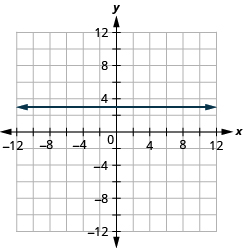
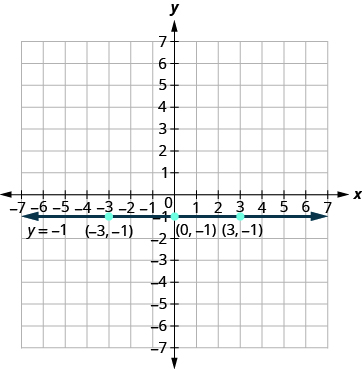
A horizontal line is the graph of an equation of the form .
The line passes through the y -axis at .
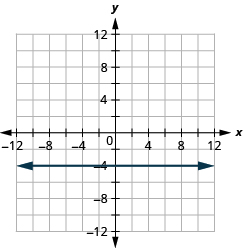
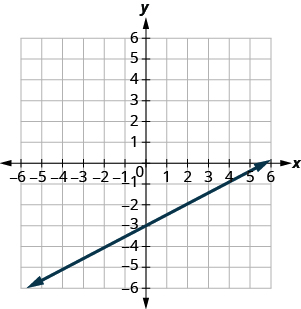
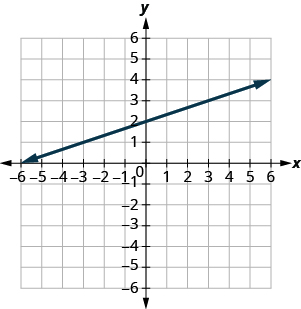
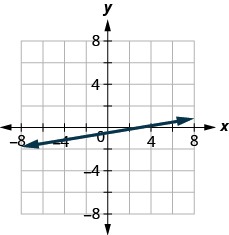
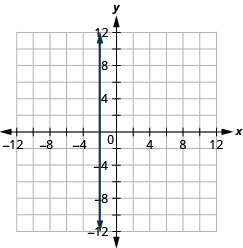
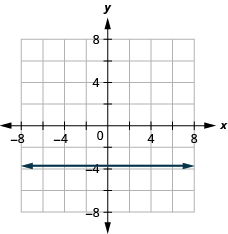
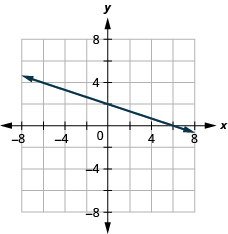
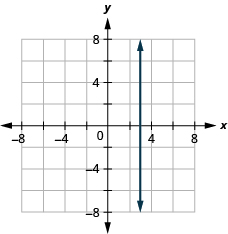
Graph the equation
The equation has only one variable, . The value of is constant. All the ordered pairs in [link] have the same y -coordinate. The graph is a horizontal line passing through the y -axis at , as shown in [link] .
| 0 | ||
| 3 | ||
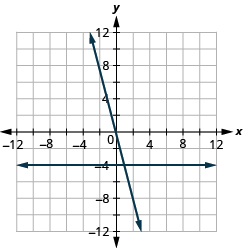
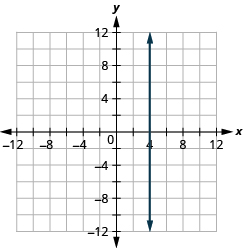
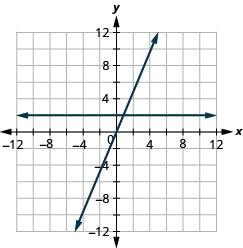
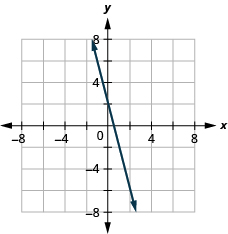
The equations for vertical and horizontal lines look very similar to equations like What is the difference between the equations and ?
The equation has both and . The value of depends on the value of . The y -coordinate changes according to the value of . The equation has only one variable. The value of is constant. The y -coordinate is always 4. It does not depend on the value of . See [link] .
| 0 | 0 | 0 | 4 | ||
| 1 | 4 | 1 | 4 | ||
| 2 | 8 | 2 | 4 |
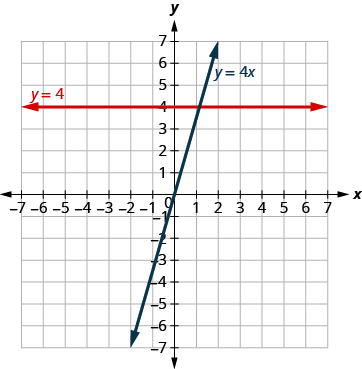
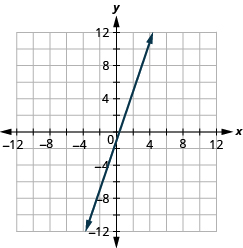
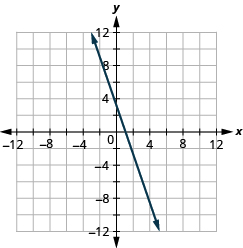
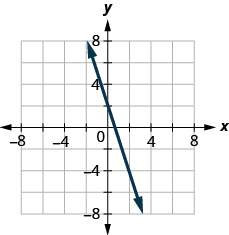
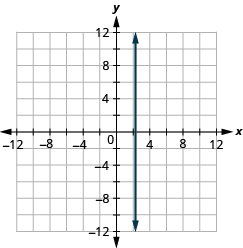
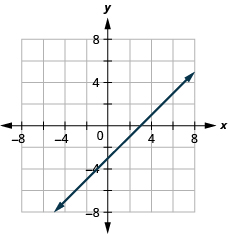
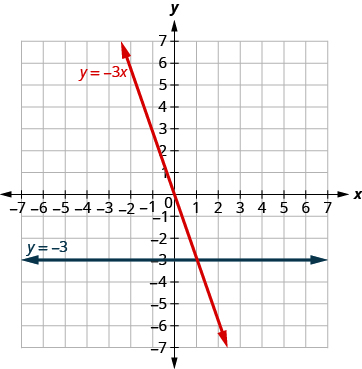
Notice, in [link] , the equation gives a slanted line, while gives a horizontal line.
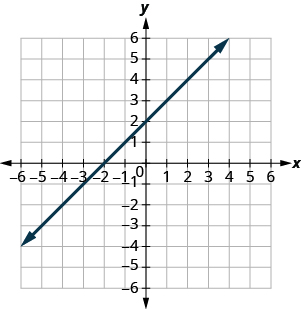
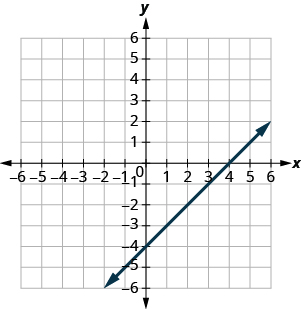
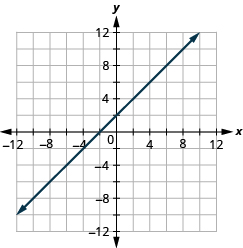
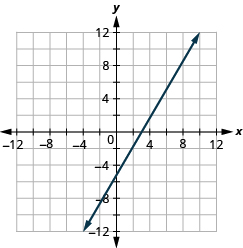
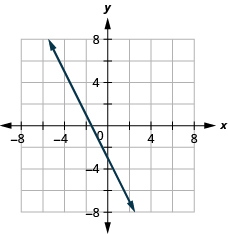
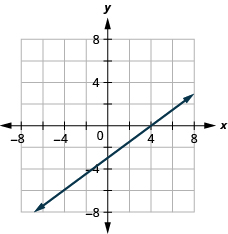
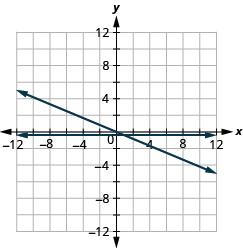
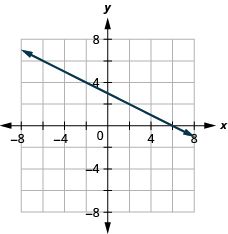
Graph and in the same rectangular coordinate system.
Notice that the first equation has the variable , while the second does not. See [link] . The two graphs are shown in [link] .
| 0 | 0 | 0 | |||
| 1 | 1 | ||||
| 2 | 2 |
Recognize the Relationship Between the Solutions of an Equation and its Graph
In the following exercises, for each ordered pair, decide:
ⓐ Is the ordered pair a solution to the equation? ⓑ Is the point on the line?
Graph a Linear Equation by Plotting Points
In the following exercises, graph by plotting points.
Graph Vertical and Horizontal Lines
In the following exercises, graph each equation.
In the following exercises, graph each pair of equations in the same rectangular coordinate system.
In the following exercises, graph each equation.
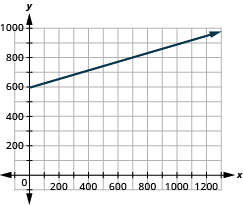
Motor home cost. The Robinsons rented a motor home for one week to go on vacation. It cost them $594 plus $0.32 per mile to rent the motor home, so the linear equation gives the cost, , for driving miles. Calculate the rental cost for driving 400, 800, and 1200 miles, and then graph the line.
$722, $850, $978
Weekly earnings. At the art gallery where he works, Salvador gets paid $200 per week plus 15% of the sales he makes, so the equation gives the amount, , he earns for selling dollars of artwork. Calculate the amount Salvador earns for selling $900, $1600, and $2000, and then graph the line.
Explain how you would choose three x - values to make a table to graph the line .
Answers will vary.
What is the difference between the equations of a vertical and a horizontal line?
ⓐ After completing the exercises, use this checklist to evaluate your mastery of the objectives of this section.

ⓑ After reviewing this checklist, what will you do to become confident for all goals?
Notification Switch
Would you like to follow the 'Elementary algebra' conversation and receive update notifications?

|
|

|
|

|
|

|
|

|
|

|
|

|
|

|
|

|
|

|