

| << Chapter < Page | Chapter >> Page > |
Before you get started, take this readiness quiz.
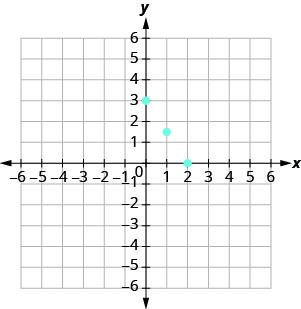
In the previous section, we found several solutions to the equation . They are listed in [link] . So, the ordered pairs , , and are some solutions to the equation . We can plot these solutions in the rectangular coordinate system as shown in [link] .
| 0 | 3 | |
| 2 | 0 | |
| 1 |
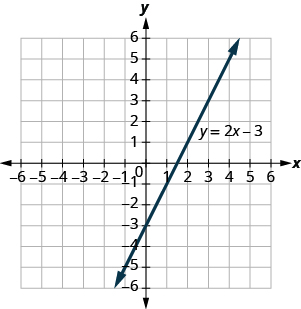
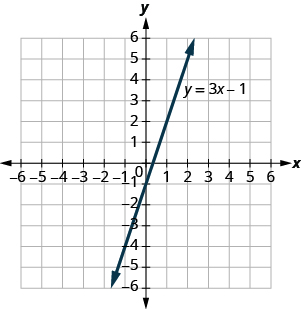
Notice how the points line up perfectly? We connect the points with a line to get the graph of the equation . See [link] . Notice the arrows on the ends of each side of the line. These arrows indicate the line continues.
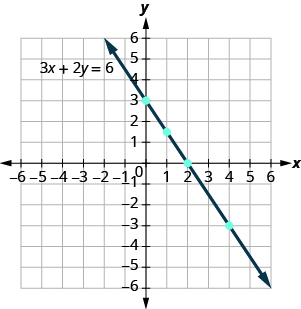
Every point on the line is a solution of the equation. Also, every solution of this equation is a point on this line. Points not on the line are not solutions.
Notice that the point whose coordinates are is on the line shown in [link] . If you substitute and into the equation, you find that it is a solution to the equation.
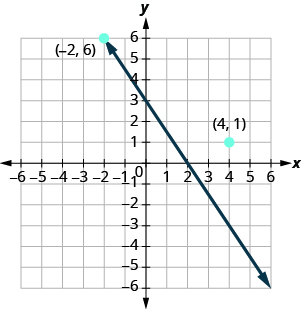
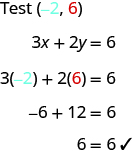
So the point is a solution to the equation . (The phrase “the point whose coordinates are ” is often shortened to “the point .”)
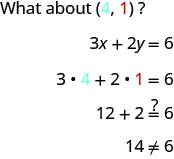
So is not a solution to the equation . Therefore, the point is not on the line. See [link] . This is an example of the saying, “A picture is worth a thousand words.” The line shows you all the solutions to the equation. Every point on the line is a solution of the equation. And, every solution of this equation is on this line. This line is called the graph of the equation .
The graph of a linear equation is a line.
The graph of is shown.
For each ordered pair, decide:
ⓐ Is the ordered pair a solution to the equation?
ⓑ Is the point on the line?
A B C D
Substitute the x - and y - values into the equation to check if the ordered pair is a solution to the equation.
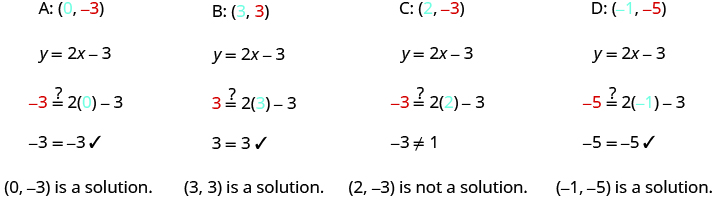
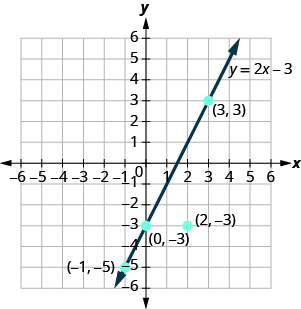
The points , , and are on the line , and the point is not on the line.
The points that are solutions to are on the line, but the point that is not a solution is not on the line.
Use the graph of to decide whether each ordered pair is:
ⓐ ⓑ
ⓐ yes, yes ⓑ yes, yes
Use graph of to decide whether each ordered pair is:
ⓐ ⓑ
ⓐ no, no ⓑ yes, yes
There are several methods that can be used to graph a linear equation. The method we used to graph is called plotting points, or the Point–Plotting Method.
Notification Switch
Would you like to follow the 'Elementary algebra' conversation and receive update notifications?

|
|

|
|

|
|

|
|

|
|

|
|

|
|

|
|

|
|

|