| << Chapter < Page | Chapter >> Page > |
The steps to take when graphing a linear equation by plotting points are summarized below.
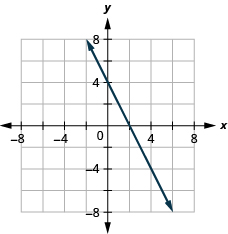
It is true that it only takes two points to determine a line, but it is a good habit to use three points. If you only plot two points and one of them is incorrect, you can still draw a line but it will not represent the solutions to the equation. It will be the wrong line.
If you use three points, and one is incorrect, the points will not line up. This tells you something is wrong and you need to check your work. Look at the difference between part (a) and part (b) in [link] .

Let’s do another example. This time, we’ll show the last two steps all on one grid.
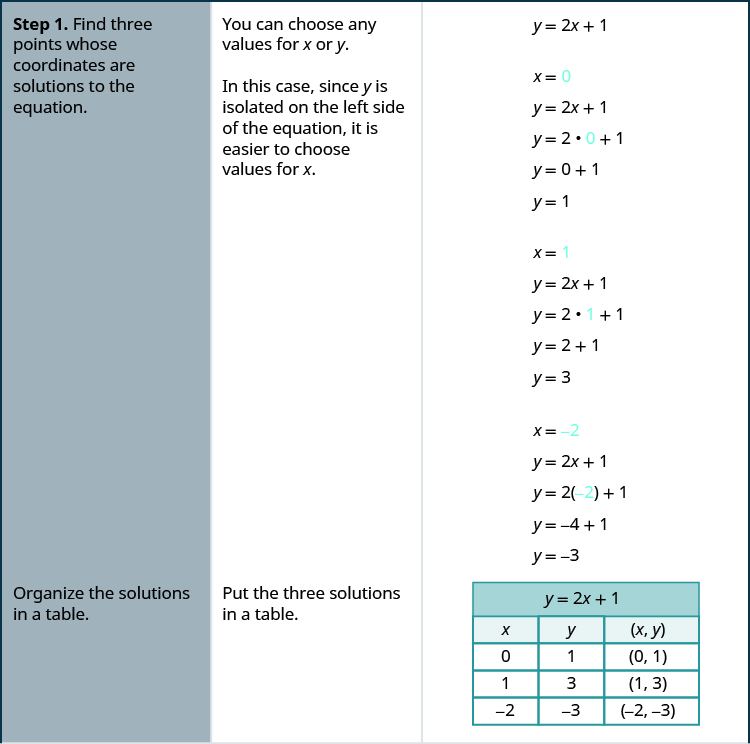
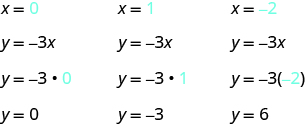
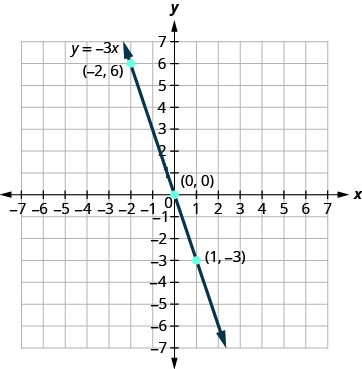
Graph the equation .
Find three points that are solutions to the equation. Here, again, it’s easier to choose values for
. Do you see why?
We list the points in
[link] .
| 0 | 0 | |
| 1 | ||
| 6 |
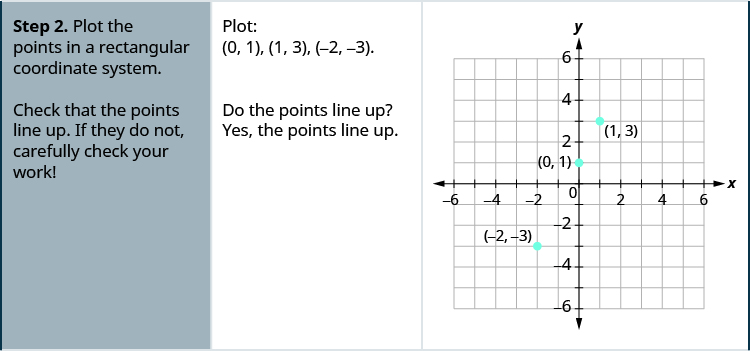
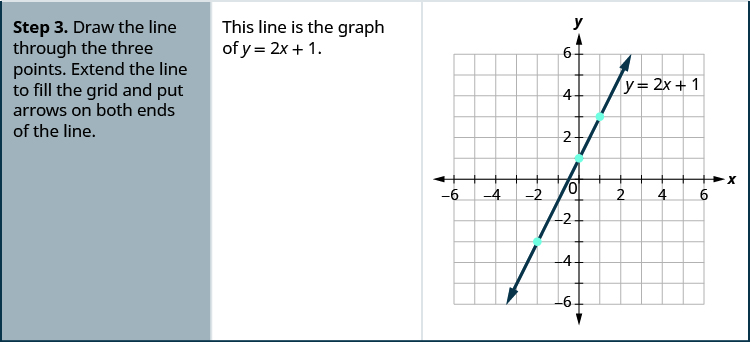
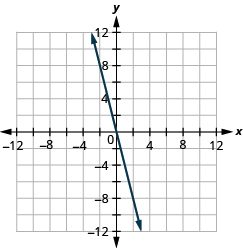
Plot the points, check that they line up, and draw the line.
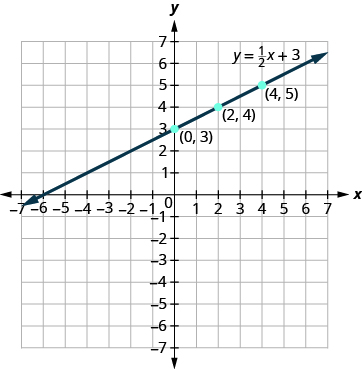
When an equation includes a fraction as the coefficient of , we can still substitute any numbers for . But the math is easier if we make ‘good’ choices for the values of . This way we will avoid fraction answers, which are hard to graph precisely.
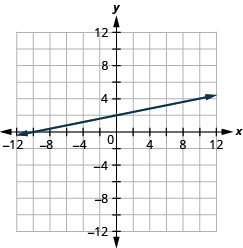
Graph the equation .
Find three points that are solutions to the equation. Since this equation has the fraction
as a coefficient of
we will choose values of
carefully. We will use zero as one choice and multiples of 2 for the other choices. Why are multiples of 2 a good choice for values of
?
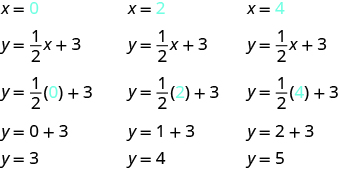
The points are shown in [link] .
| 0 | 3 | |
| 2 | 4 | |
| 4 | 5 |
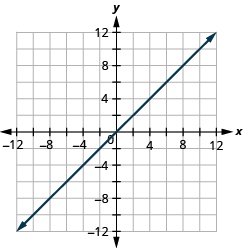
Plot the points, check that they line up, and draw the line.
So far, all the equations we graphed had given in terms of . Now we’ll graph an equation with and on the same side. Let’s see what happens in the equation . If what is the value of ?
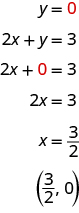
This point has a fraction for the x - coordinate and, while we could graph this point, it is hard to be precise graphing fractions. Remember in the example , we carefully chose values for so as not to graph fractions at all. If we solve the equation for , it will be easier to find three solutions to the equation.
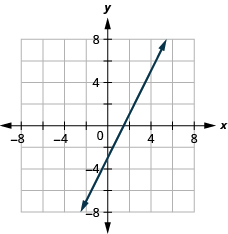
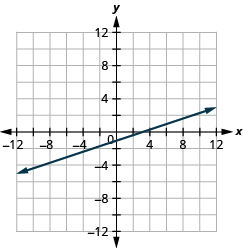
The solutions for , , and are shown in the [link] . The graph is shown in [link] .
| 0 | 3 | |
| 1 | 1 | |
| 5 |
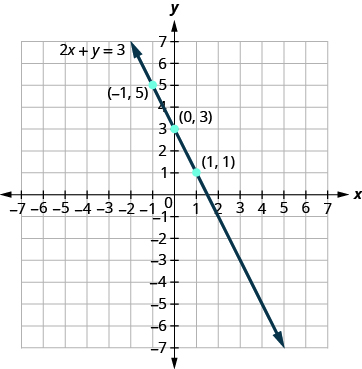
Can you locate the point , which we found by letting , on the line?
Notification Switch
Would you like to follow the 'Elementary algebra' conversation and receive update notifications?

|
|

|
|

|
|

|
|

|
|

|
|

|
|

|
|

|
|

|