<< Chapter < Page Chapter >> Page >
By the end of this section, you will be able to:
  • Verify solutions to an inequality in two variables
  • Recognize the relation between the solutions of an inequality and its graph
  • Graph linear inequalities

Before you get started, take this readiness quiz.

  1. Solve: 4 x + 3 > 23 .
    If you missed this problem, review [link] .
  2. Translate from algebra to English: x < 5 .
    If you missed this problem, review [link] .
  3. Evaluate 3 x 2 y when x = 1 , y = −2 .
    If you missed this problem, review [link] .

Verify solutions to an inequality in two variables

We have learned how to solve inequalities in one variable. Now, we will look at inequalities in two variables. Inequalities in two variables have many applications. If you ran a business, for example, you would want your revenue to be greater than your costs—so that your business would make a profit.

Linear inequality

A linear inequality    is an inequality that can be written in one of the following forms:

A x + B y > C A x + B y C A x + B y < C A x + B y C

where A and B are not both zero.

Do you remember that an inequality with one variable had many solutions? The solution to the inequality x > 3 is any number greater than 3. We showed this on the number line by shading in the number line to the right of 3, and putting an open parenthesis at 3. See [link] .

The figure shows a number line extending from negative 5 to 5. A parenthesis is shown at positive 3 and an arrow extends form positive 3 to positive infinity.

Similarly, inequalities in two variables have many solutions. Any ordered pair ( x , y ) that makes the inequality true when we substitute in the values is a solution of the inequality.

Solution of a linear inequality

An ordered pair ( x , y ) is a solution of a linear inequality    if the inequality is true when we substitute the values of x and y .

Determine whether each ordered pair is a solution to the inequality y > x + 4 :

( 0 , 0 ) ( 1 , 6 ) ( 2 , 6 ) ( −5 , −15 ) ( −8 , 12 )


  1. ( 0 , 0 ) .
    . .
    Simplify. .
    So, ( 0 , 0 ) is not a solution to y > x + 4 .

  2. ( 1 , 6 ) .
    . .
    Simplify. .
    So, ( 1 , 6 ) is a solution to y > x + 4 .

  3. ( 2 , 6 ) .
    . .
    Simplify. .
    So, ( 2 , 6 ) is not a solution to y > x + 4 .

  4. ( −5 , −15 ) .
    . .
    Simplify. .
    So, ( −5 , −15 ) is not a solution to y > x + 4 .

  5. ( −8 , 12 ) .
    . .
    Simplify. .
    So, ( −8 , 12 ) is a solution to y > x + 4 .
Got questions? Get instant answers now!

Determine whether each ordered pair is a solution to the inequality y > x 3 :

( 0 , 0 ) ( 4 , 9 ) ( −2 , 1 ) ( −5 , −3 ) ( 5 , 1 )

yes  yes  yes  yes  no

Got questions? Get instant answers now!

Determine whether each ordered pair is a solution to the inequality y < x + 1 :

( 0 , 0 ) ( 8 , 6 ) ( −2 , −1 ) ( 3 , 4 ) ( −1 , −4 )

yes  yes  no  no  yes

Got questions? Get instant answers now!

Recognize the relation between the solutions of an inequality and its graph

Now, we will look at how the solutions of an inequality relate to its graph.

Let’s think about the number line in [link] again. The point x = 3 separated that number line into two parts. On one side of 3 are all the numbers less than 3. On the other side of 3 all the numbers are greater than 3. See [link] .
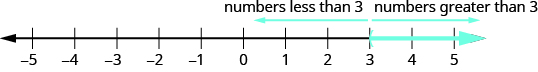
The figure shows a number line extending from negative 5 to 5. A parenthesis is shown at positive 3 and an arrow extends form positive 3 to positive infinity. An arrow above the number line extends from 3 and points to the left. It is labeled “numbers less than 3.” An arrow above the number line extends from 3 and points to the right. It is labeled “numbers greater than 3.”

The solution to x > 3 is the shaded part of the number line to the right of x = 3 .

Similarly, the line y = x + 4 separates the plane into two regions. On one side of the line are points with y < x + 4 . On the other side of the line are the points with y > x + 4 . We call the line y = x + 4 a boundary line.

Boundary line

The line with equation A x + B y = C is the boundary line    that separates the region where A x + B y > C from the region where A x + B y < C .

For an inequality in one variable, the endpoint is shown with a parenthesis or a bracket depending on whether or not a is included in the solution:

Questions & Answers

how do you get the 2/50
Abba Reply
number of sport play by 50 student construct discrete data
Aminu Reply
width of the frangebany leaves on how to write a introduction
Theresa Reply
Solve the mean of variance
Veronica Reply
Step 1: Find the mean. To find the mean, add up all the scores, then divide them by the number of scores. ... Step 2: Find each score's deviation from the mean. ... Step 3: Square each deviation from the mean. ... Step 4: Find the sum of squares. ... Step 5: Divide the sum of squares by n – 1 or N.
kenneth
what is error
Yakuba Reply
Is mistake done to something
Vutshila
Hy
anas
hy
What is the life teble
anas
hy
Jibrin
statistics is the analyzing of data
Tajudeen Reply
what is statics?
Zelalem Reply
how do you calculate mean
Gloria Reply
diveving the sum if all values
Shaynaynay
let A1,A2 and A3 events be independent,show that (A1)^c, (A2)^c and (A3)^c are independent?
Fisaye Reply
what is statistics
Akhisani Reply
data collected all over the world
Shaynaynay
construct a less than and more than table
Imad Reply
The sample of 16 students is taken. The average age in the sample was 22 years with astandard deviation of 6 years. Construct a 95% confidence interval for the age of the population.
Aschalew Reply
Bhartdarshan' is an internet-based travel agency wherein customer can see videos of the cities they plant to visit. The number of hits daily is a normally distributed random variable with a mean of 10,000 and a standard deviation of 2,400 a. what is the probability of getting more than 12,000 hits? b. what is the probability of getting fewer than 9,000 hits?
Akshay Reply
Bhartdarshan'is an internet-based travel agency wherein customer can see videos of the cities they plan to visit. The number of hits daily is a normally distributed random variable with a mean of 10,000 and a standard deviation of 2,400. a. What is the probability of getting more than 12,000 hits
Akshay
1
Bright
Sorry i want to learn more about this question
Bright
Someone help
Bright
a= 0.20233 b=0.3384
Sufiyan
a
Shaynaynay
How do I interpret level of significance?
Mohd Reply
It depends on your business problem or in Machine Learning you could use ROC- AUC cruve to decide the threshold value
Shivam
how skewness and kurtosis are used in statistics
Owen Reply
yes what is it
Taneeya
Got questions? Join the online conversation and get instant answers!
Jobilize.com Reply
Practice Key Terms 3

Get Jobilize Job Search Mobile App in your pocket Now!

Get it on Google Play Download on the App Store Now


Source:  OpenStax, Elementary algebra. OpenStax CNX. Jan 18, 2017 Download for free at http://cnx.org/content/col12116/1.2
Google Play and the Google Play logo are trademarks of Google Inc.

Notification Switch

Would you like to follow the 'Elementary algebra' conversation and receive update notifications?

Ask