| << Chapter < Page | Chapter >> Page > |
Before you get started, take this readiness quiz.
We have graphed equations of the form . We called equations like this linear equations because their graphs are straight lines.
Now, we will graph equations of the form . We call this kind of equation a quadratic equation in two variables .
A quadratic equation in two variables , where are real numbers and , is an equation of the form
Just like we started graphing linear equations by plotting points, we will do the same for quadratic equations.
Let’s look first at graphing the quadratic equation . We will choose integer values of between and 2 and find their values. See [link] .
| 0 | 0 |
| 1 | 1 |
| 1 | |
| 2 | 4 |
| 4 |
Notice when we let and , we got the same value for .
The same thing happened when we let and .
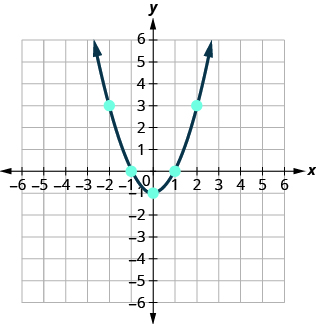
Now, we will plot the points to show the graph of . See [link] .
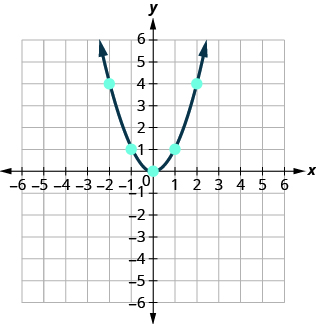
The graph is not a line. This figure is called a parabola . Every quadratic equation has a graph that looks like this.
In [link] you will practice graphing a parabola by plotting a few points.
Graph .
We will graph the equation by plotting points.
| Choose integers values for x , substitute them into the equation and solve for y . | |
| Record the values of the ordered pairs in the chart. |
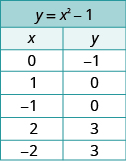 |
| Plot the points, and then connect them with a smooth curve. The result will be the graph of the equation . |
 |
How do the equations and differ? What is the difference between their graphs? How are their graphs the same?
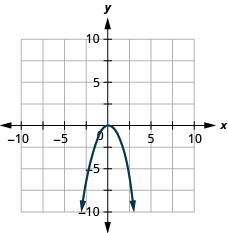
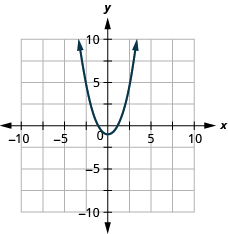
All parabolas of the form open upwards or downwards. See [link] .
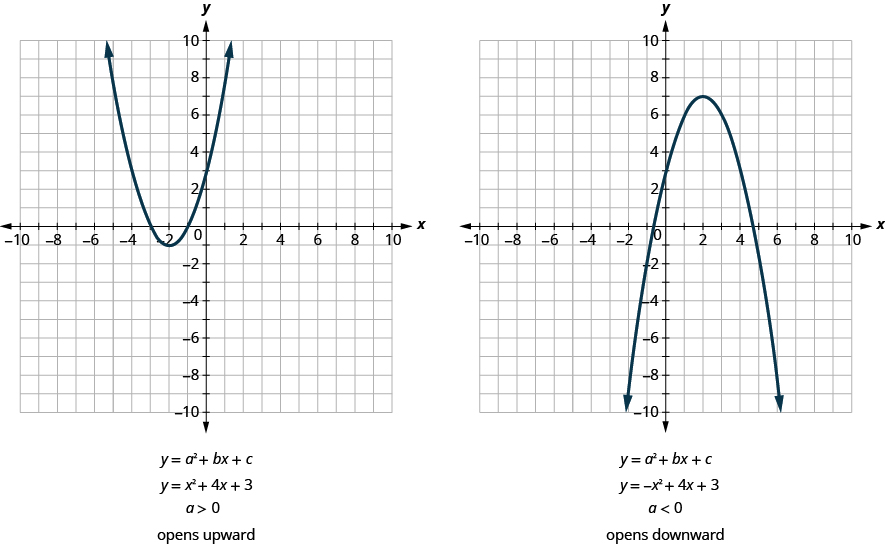
Notice that the only difference in the two equations is the negative sign before the in the equation of the second graph in [link] . When the term is positive, the parabola opens upward, and when the term is negative, the parabola opens downward.
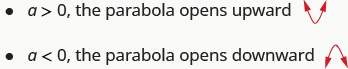
For the quadratic equation , if:
Determine whether each parabola opens upward or downward:
ⓐ ⓑ
|
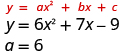
ⓐ
Find the value of " a ". |
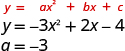
Since the “a” is negative, the parabola will open downward. |
|
ⓑ
Find the value of " a ". |
Since the “a” is positive, the parabola will open upward. |
Determine whether each parabola opens upward or downward:
ⓐ ⓑ
ⓐ up ⓑ down
Determine whether each parabola opens upward or downward:
ⓐ ⓑ
ⓐ down ⓑ up
Look again at [link] . Do you see that we could fold each parabola in half and that one side would lie on top of the other? The ‘fold line’ is a line of symmetry. We call it the axis of symmetry of the parabola.
Notification Switch
Would you like to follow the 'Elementary algebra' conversation and receive update notifications?

|
|

|
|

|
|

|
|

|
|

|
|

|
|

|
|

|
|

|