<< Chapter < Page Chapter >> Page >

Using the midpoint formula

When the endpoints of a line segment are known, we can find the point midway between them. This point is known as the midpoint and the formula is known as the midpoint formula    . Given the endpoints of a line segment, ( x 1 , y 1 ) and ( x 2 , y 2 ) , the midpoint formula states how to find the coordinates of the midpoint M .

M = ( x 1 + x 2 2 , y 1 + y 2 2 )

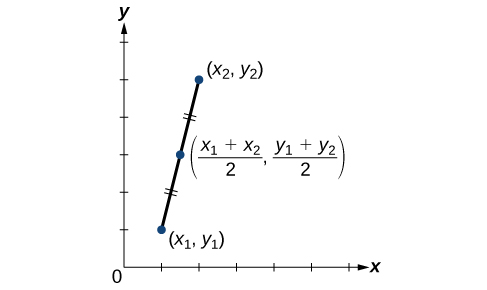
A graphical view of a midpoint is shown in [link] . Notice that the line segments on either side of the midpoint are congruent.

This is a line graph on an x, y coordinate plane with the x and y axes ranging from 0 to 6. The points (x sub 1, y sub 1), (x sub 2, y sub 2), and (x sub 1 plus x sub 2 all over 2, y sub 1 plus y sub 2 all over 2) are plotted.  A straight line runs through these three points. Pairs of short parallel lines bisect the two sections of the line to note that they are equivalent.

Finding the midpoint of the line segment

Find the midpoint of the line segment with the endpoints ( 7 , −2 ) and ( 9 , 5 ) .

Use the formula to find the midpoint of the line segment.

( x 1 + x 2 2 , y 1 + y 2 2 ) = ( 7 + 9 2 , 2 + 5 2 ) = ( 8 , 3 2 )
Got questions? Get instant answers now!

Find the midpoint of the line segment with endpoints ( −2 , −1 ) and ( −8 , 6 ) .

( 5 , 5 2 )

Got questions? Get instant answers now!

Finding the center of a circle

The diameter of a circle has endpoints ( −1 , −4 ) and ( 5 , −4 ) . Find the center of the circle.

The center of a circle is the center, or midpoint, of its diameter. Thus, the midpoint formula will yield the center point.

( x 1 + x 2 2 , y 1 + y 2 2 ) ( 1 + 5 2 , 4 4 2 ) = ( 4 2 , 8 2 ) = ( 2 , −4 )
Got questions? Get instant answers now!

Access these online resources for additional instruction and practice with the Cartesian coordinate system.

Key concepts

  • We can locate, or plot, points in the Cartesian coordinate system using ordered pairs, which are defined as displacement from the x- axis and displacement from the y- axis. See [link] .
  • An equation can be graphed in the plane by creating a table of values and plotting points. See [link] .
  • Using a graphing calculator or a computer program makes graphing equations faster and more accurate. Equations usually have to be entered in the form y= _____. See [link] .
  • Finding the x- and y- intercepts can define the graph of a line. These are the points where the graph crosses the axes. See [link] .
  • The distance formula is derived from the Pythagorean Theorem and is used to find the length of a line segment. See [link] and [link] .
  • The midpoint formula provides a method of finding the coordinates of the midpoint dividing the sum of the x -coordinates and the sum of the y -coordinates of the endpoints by 2. See [link] and [link] .

Section exercises

Verbal

Is it possible for a point plotted in the Cartesian coordinate system to not lie in one of the four quadrants? Explain.

Answers may vary. Yes. It is possible for a point to be on the x -axis or on the y -axis and therefore is considered to NOT be in one of the quadrants.

Got questions? Get instant answers now!

Describe the process for finding the x- intercept and the y -intercept of a graph algebraically.

Got questions? Get instant answers now!

Describe in your own words what the y -intercept of a graph is.

The y -intercept is the point where the graph crosses the y -axis.

Got questions? Get instant answers now!

When using the distance formula d = ( x 2 x 1 ) 2 + ( y 2 y 1 ) 2 , explain the correct order of operations that are to be performed to obtain the correct answer.

Got questions? Get instant answers now!

Algebraic

For each of the following exercises, find the x -intercept and the y -intercept without graphing. Write the coordinates of each intercept.

y = −3 x + 6

The x- intercept is ( 2 , 0 ) and the y -intercept is ( 0 , 6 ) .

Got questions? Get instant answers now!

3 x 2 y = 6

The x- intercept is ( 2 , 0 ) and the y -intercept is ( 0 , −3 ) .

Got questions? Get instant answers now!

Questions & Answers

how do you get the 2/50
Abba Reply
number of sport play by 50 student construct discrete data
Aminu Reply
width of the frangebany leaves on how to write a introduction
Theresa Reply
Solve the mean of variance
Veronica Reply
Step 1: Find the mean. To find the mean, add up all the scores, then divide them by the number of scores. ... Step 2: Find each score's deviation from the mean. ... Step 3: Square each deviation from the mean. ... Step 4: Find the sum of squares. ... Step 5: Divide the sum of squares by n – 1 or N.
kenneth
what is error
Yakuba Reply
Is mistake done to something
Vutshila
Hy
anas
hy
What is the life teble
anas
hy
Jibrin
statistics is the analyzing of data
Tajudeen Reply
what is statics?
Zelalem Reply
how do you calculate mean
Gloria Reply
diveving the sum if all values
Shaynaynay
let A1,A2 and A3 events be independent,show that (A1)^c, (A2)^c and (A3)^c are independent?
Fisaye Reply
what is statistics
Akhisani Reply
data collected all over the world
Shaynaynay
construct a less than and more than table
Imad Reply
The sample of 16 students is taken. The average age in the sample was 22 years with astandard deviation of 6 years. Construct a 95% confidence interval for the age of the population.
Aschalew Reply
Bhartdarshan' is an internet-based travel agency wherein customer can see videos of the cities they plant to visit. The number of hits daily is a normally distributed random variable with a mean of 10,000 and a standard deviation of 2,400 a. what is the probability of getting more than 12,000 hits? b. what is the probability of getting fewer than 9,000 hits?
Akshay Reply
Bhartdarshan'is an internet-based travel agency wherein customer can see videos of the cities they plan to visit. The number of hits daily is a normally distributed random variable with a mean of 10,000 and a standard deviation of 2,400. a. What is the probability of getting more than 12,000 hits
Akshay
1
Bright
Sorry i want to learn more about this question
Bright
Someone help
Bright
a= 0.20233 b=0.3384
Sufiyan
a
Shaynaynay
How do I interpret level of significance?
Mohd Reply
It depends on your business problem or in Machine Learning you could use ROC- AUC cruve to decide the threshold value
Shivam
how skewness and kurtosis are used in statistics
Owen Reply
yes what is it
Taneeya
Got questions? Join the online conversation and get instant answers!
Jobilize.com Reply

Get Jobilize Job Search Mobile App in your pocket Now!

Get it on Google Play Download on the App Store Now


Source:  OpenStax, Algebra and trigonometry. OpenStax CNX. Nov 14, 2016 Download for free at https://legacy.cnx.org/content/col11758/1.6
Google Play and the Google Play logo are trademarks of Google Inc.

Notification Switch

Would you like to follow the 'Algebra and trigonometry' conversation and receive update notifications?

Ask