A museum charges $5 per person for a guided tour with a group of 1 to 9 people or a fixed $50 fee for a group of 10 or more people. Write a
function relating the number of people,
to the cost,
Two different formulas will be needed. For
n -values under 10,
For values of
that are 10 or greater,
A cell phone company uses the function below to determine the cost,
in dollars for
gigabytes of data transfer.
Find the cost of using 1.5 gigabytes of data and the cost of using 4 gigabytes of data.
To find the cost of using 1.5 gigabytes of data,
we first look to see which part of the domain our input falls in. Because 1.5 is less than 2, we use the first formula.
To find the cost of using 4 gigabytes of data,
we see that our input of 4 is greater than 2, so we use the second formula.
Indicate on the
x -axis the boundaries defined by the intervals on each piece of the domain.
For each piece of the domain, graph on that interval using the corresponding equation pertaining to that piece. Do not graph two functions over one interval because it would violate the criteria of a function.
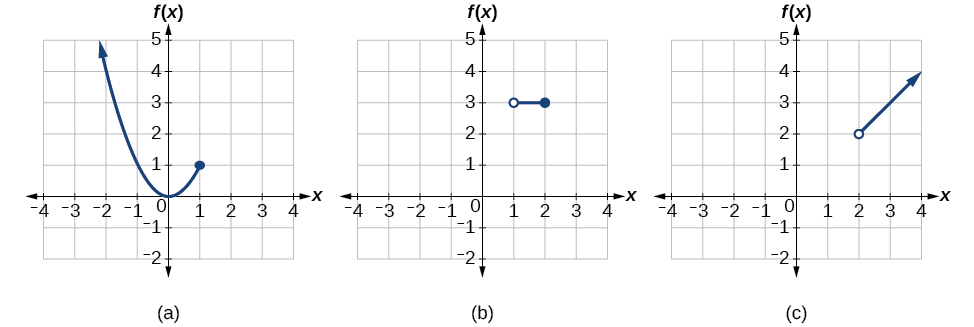
Graphing a piecewise function
Sketch a graph of the function.
Each of the component functions is from our library of toolkit functions, so we know their shapes. We can imagine graphing each function and then limiting the graph to the indicated domain. At the endpoints of the domain, we draw open circles to indicate where the endpoint is not included because of a less-than or greater-than inequality; we draw a closed circle where the endpoint is included because of a less-than-or-equal-to or greater-than-or-equal-to inequality.
[link] shows the three components of the piecewise function graphed on separate coordinate systems.
(a)
(b)
(c)
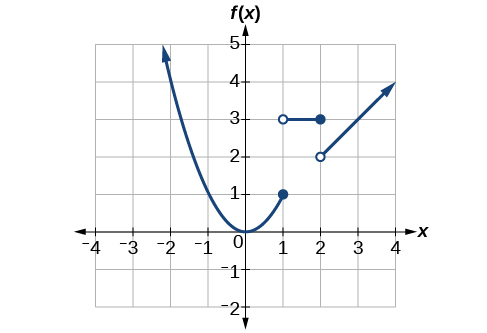
Now that we have sketched each piece individually, we combine them in the same coordinate plane. See
[link] .
The domain of a function includes all real input values that would not cause us to attempt an undefined mathematical operation, such as dividing by zero or taking the square root of a negative number.
The domain of a function can be determined by listing the input values of a set of ordered pairs. See
[link] .
The domain of a function can also be determined by identifying the input values of a function written as an equation. See
[link] ,
[link] , and
[link] .
Interval values represented on a number line can be described using inequality notation, set-builder notation, and interval notation. See
[link] .
For many functions, the domain and range can be determined from a graph. See
[link] and
[link] .
An understanding of toolkit functions can be used to find the domain and range of related functions. See
[link] ,
[link] , and
[link] .
A piecewise function is described by more than one formula. See
[link] and
[link] .
A piecewise function can be graphed using each algebraic formula on its assigned subdomain. See
[link] .
Questions & Answers
Ayele, K., 2003. Introductory Economics, 3rd ed., Addis Ababa.
what's the difference between a firm and an industry
Abdul
firm is the unit which transform inputs to output where as industry contain combination of firms with similar production 😅😅
Abdulraufu
Suppose the demand function that a firm faces shifted from
Qd 120 3P
to
Qd 90 3P
and the supply function has shifted from
QS
20 2P
to
QS
10 2P .
a) Find the effect of this change on price and quantity.
b) Which of the changes in demand and supply is higher?
Demand curve shows that how supply and others conditions affect on demand of a particular thing and what percent demand increase whith increase of supply of goods
Israr
Hi Sir please how do u calculate Cross elastic demand and income elastic demand?
Abari
Got questions? Join the online conversation and get instant answers!