A museum charges $5 per person for a guided tour with a group of 1 to 9 people or a fixed $50 fee for a group of 10 or more people. Write a
function relating the number of people,
to the cost,
Two different formulas will be needed. For
n -values under 10,
For values of
that are 10 or greater,
A cell phone company uses the function below to determine the cost,
in dollars for
gigabytes of data transfer.
Find the cost of using 1.5 gigabytes of data and the cost of using 4 gigabytes of data.
To find the cost of using 1.5 gigabytes of data,
we first look to see which part of the domain our input falls in. Because 1.5 is less than 2, we use the first formula.
To find the cost of using 4 gigabytes of data,
we see that our input of 4 is greater than 2, so we use the second formula.
Indicate on the
x -axis the boundaries defined by the intervals on each piece of the domain.
For each piece of the domain, graph on that interval using the corresponding equation pertaining to that piece. Do not graph two functions over one interval because it would violate the criteria of a function.
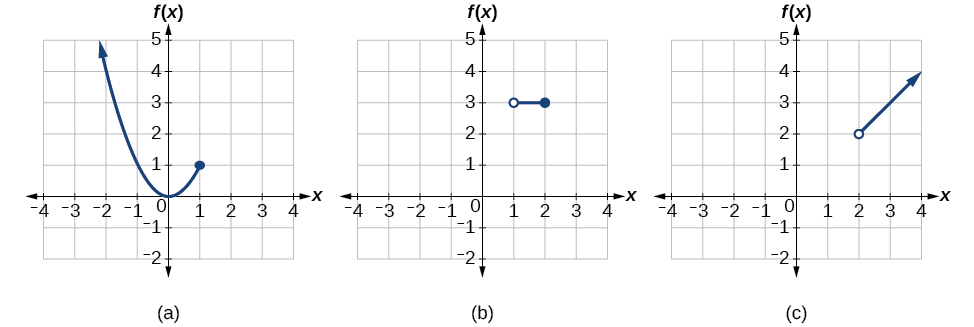
Graphing a piecewise function
Sketch a graph of the function.
Each of the component functions is from our library of toolkit functions, so we know their shapes. We can imagine graphing each function and then limiting the graph to the indicated domain. At the endpoints of the domain, we draw open circles to indicate where the endpoint is not included because of a less-than or greater-than inequality; we draw a closed circle where the endpoint is included because of a less-than-or-equal-to or greater-than-or-equal-to inequality.
[link] shows the three components of the piecewise function graphed on separate coordinate systems.
(a)
(b)
(c)
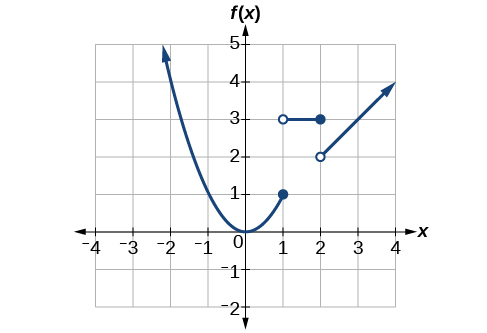
Now that we have sketched each piece individually, we combine them in the same coordinate plane. See
[link] .
The domain of a function includes all real input values that would not cause us to attempt an undefined mathematical operation, such as dividing by zero or taking the square root of a negative number.
The domain of a function can be determined by listing the input values of a set of ordered pairs. See
[link] .
The domain of a function can also be determined by identifying the input values of a function written as an equation. See
[link] ,
[link] , and
[link] .
Interval values represented on a number line can be described using inequality notation, set-builder notation, and interval notation. See
[link] .
For many functions, the domain and range can be determined from a graph. See
[link] and
[link] .
An understanding of toolkit functions can be used to find the domain and range of related functions. See
[link] ,
[link] , and
[link] .
A piecewise function is described by more than one formula. See
[link] and
[link] .
A piecewise function can be graphed using each algebraic formula on its assigned subdomain. See
[link] .
Questions & Answers
differentiate between demand and supply
giving examples
In economics, a perfect market refers to a theoretical construct where all participants have perfect information, goods are homogenous, there are no barriers to entry or exit, and prices are determined solely by supply and demand. It's an idealized model used for analysis,
When MP₁ becomes negative, TP start to decline.
Extuples Suppose that the short-run production function of certain cut-flower firm is given by: Q=4KL-0.6K2 - 0.112 •
Where is quantity of cut flower produced, I is labour input and K is fixed capital input (K-5). Determine the average product of lab
Kelo
Extuples Suppose that the short-run production function of certain cut-flower firm is given by: Q=4KL-0.6K2 - 0.112 •
Where is quantity of cut flower produced, I is labour input and K is fixed capital input (K-5). Determine the average product of labour (APL) and marginal product of labour (MPL)
Quantity demanded refers to the specific amount of a good or service that consumers are willing and able to purchase at a give price and within a specific time period. Demand, on the other hand, is a broader concept that encompasses the entire relationship between price and quantity demanded
Ezea
ok
Shukri
how do you save a country economic situation when it's falling apart
Economic growth as an increase in the production and consumption of goods and services within an economy.but
Economic development as a broader concept that encompasses not only economic growth but also social & human well being.
Shukri
production function means
Jabir
What do you think is more important to focus on when considering inequality ?
sir...I just want to ask one question... Define the term contract curve? if you are free please help me to find this answer 🙏
Asui
it is a curve that we get after connecting the pareto optimal combinations of two consumers after their mutually beneficial trade offs
Awais
thank you so much 👍 sir
Asui
In economics, the contract curve refers to the set of points in an Edgeworth box diagram where both parties involved in a trade cannot be made better off without making one of them worse off. It represents the Pareto efficient allocations of goods between two individuals or entities, where neither p
Cornelius
In economics, the contract curve refers to the set of points in an Edgeworth box diagram where both parties involved in a trade cannot be made better off without making one of them worse off. It represents the Pareto efficient allocations of goods between two individuals or entities,
Cornelius
Suppose a consumer consuming two commodities X and Y has
The following utility function u=X0.4 Y0.6. If the price of the X and Y are 2 and 3 respectively and income Constraint is birr 50.
A,Calculate quantities of x and y which maximize utility.
B,Calculate value of Lagrange multiplier.
C,Calculate quantities of X and Y consumed with a given price.
D,alculate optimum level of output .
the market for lemon has 10 potential consumers, each having an individual demand curve p=101-10Qi, where p is price in dollar's per cup and Qi is the number of cups demanded per week by the i th consumer.Find the market demand curve using algebra. Draw an individual demand curve and the market dema
suppose the production function is given by ( L, K)=L¼K¾.assuming capital is fixed find APL and MPL. consider the following short run production function:Q=6L²-0.4L³ a) find the value of L that maximizes output b)find the value of L that maximizes marginal product