<< Chapter < Page Chapter >> Page >

Sketching the graph of a rose curve ( n Even)

Sketch the graph of r = 2 cos 4 θ .

Testing for symmetry, we find again that the symmetry tests do not tell the whole story. The graph is not only symmetric with respect to the polar axis, but also with respect to the line θ = π 2 and the pole.

Now we will find the zeros. First make the substitution u = 4 θ .

0 = 2 cos 4 θ 0 = cos 4 θ 0 = cos u cos 1 0 = u u = π 2 4 θ = π 2 θ = π 8

The zero is θ = π 8 . The point ( 0 , π 8 ) is on the curve.

Next, we find the maximum | r | . We know that the maximum value of cos u = 1 when θ = 0. Thus,

r = 2 cos ( 4 0 ) r = 2 cos ( 0 ) r = 2 ( 1 ) = 2

The point ( 2 , 0 ) is on the curve.

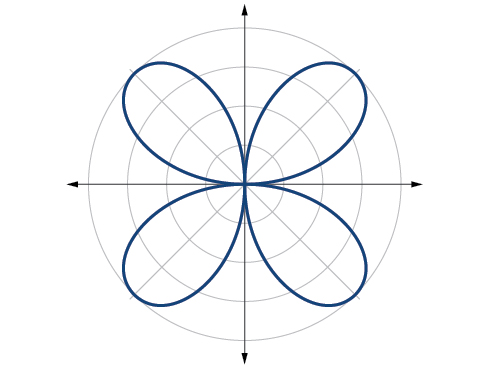
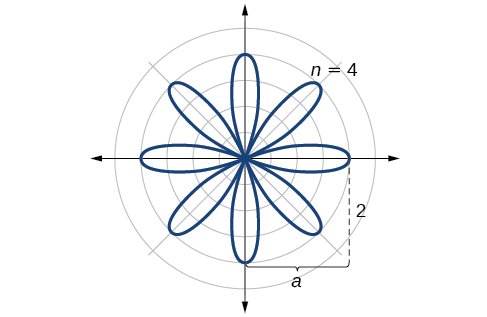
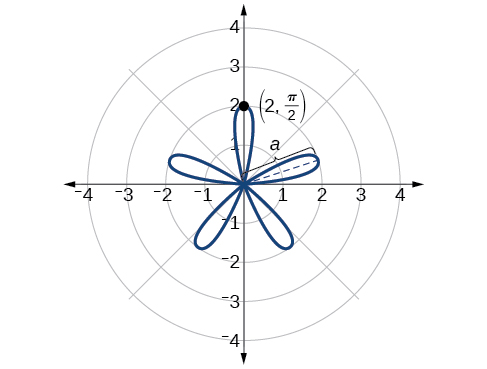
The graph of the rose curve has unique properties, which are revealed in [link] .

θ 0 π 8 π 4 3 π 8 π 2 5 π 8 3 π 4
r 2 0 −2 0 2 0 −2

As r = 0 when θ = π 8 , it makes sense to divide values in the table by π 8 units. A definite pattern emerges. Look at the range of r -values: 2, 0, −2, 0, 2, 0, −2, and so on. This represents the development of the curve one petal at a time. Starting at r = 0 , each petal extends out a distance of r = 2 , and then turns back to zero 2 n times for a total of eight petals. See the graph in [link] .

Sketch of rose curve r=2*cos(4 theta). Goes out distance of 2 for each petal 2n times (here 2*4=8 times).
Rose curve, n even
Got questions? Get instant answers now!

Sketch the graph of r = 4 sin ( 2 θ ) .

The graph is a rose curve, n even
Graph of rose curve r=4 sin(2 theta). Even - four petals equally spaced, each of length 4.

Got questions? Get instant answers now!

Sketching the graph of a rose curve ( n Odd)

Sketch the graph of r = 2 sin ( 5 θ ) .

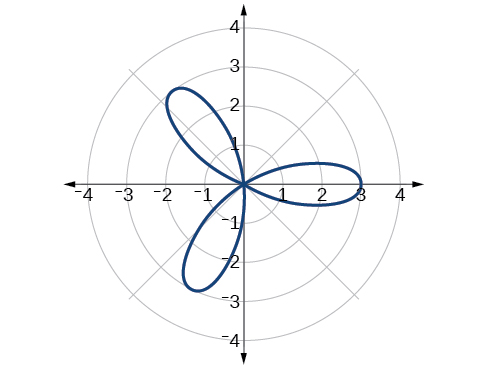
The graph of the equation shows symmetry with respect to the line θ = π 2 . Next, find the zeros and maximum. We will want to make the substitution u = 5 θ .

0 = 2 sin ( 5 θ ) 0 = sin u sin 1 0 = 0 u = 0 5 θ = 0 θ = 0

The maximum value is calculated at the angle where sin θ is a maximum. Therefore,

r = 2 sin ( 5 π 2 ) r = 2 ( 1 ) = 2

Thus, the maximum value of the polar equation is 2. This is the length of each petal. As the curve for n odd yields the same number of petals as n , there will be five petals on the graph. See [link] .

Create a table of values similar to [link] .

θ 0 π 6 π 3 π 2 2 π 3 5 π 6 π
r 0 1 −1.73 2 −1.73 1 0
Graph of rose curve r=2sin(5theta). Five petals equally spaced around origin. Point (2, pi/2) on edge is marked.
Rose curve, n odd
Got questions? Get instant answers now!

Sketch the graph of r = 3 cos ( 3 θ ).

Graph of rose curve r=3cos(3theta). Three petals equally spaced from origin.

Rose curve, n odd

Got questions? Get instant answers now!

Investigating the archimedes’ spiral

The final polar equation we will discuss is the Archimedes’ spiral, named for its discoverer, the Greek mathematician Archimedes (c. 287 BCE - c. 212 BCE), who is credited with numerous discoveries in the fields of geometry and mechanics.

Archimedes’ spiral

The formula that generates the graph of the Archimedes’ spiral    is given by r = θ for θ 0. As θ increases, r increases at a constant rate in an ever-widening, never-ending, spiraling path. See [link] .

Two graphs side by side of Archimedes' spiral. (A) is r= theta, [0, 2pi]. (B) is r=theta, [0, 4pi]. Both start at origin and spiral out counterclockwise. The second has two spirals out while the first has one.

Given an Archimedes’ spiral over [ 0 , 2 π ] , sketch the graph.

  1. Make a table of values for r and θ over the given domain.
  2. Plot the points and sketch the graph.

Sketching the graph of an archimedes’ spiral

Sketch the graph of r = θ over [ 0 , 2 π ] .

As r is equal to θ , the plot of the Archimedes’ spiral begins at the pole at the point (0, 0). While the graph hints of symmetry, there is no formal symmetry with regard to passing the symmetry tests. Further, there is no maximum value, unless the domain is restricted.

Create a table such as [link] .

θ π 4 π 2 π 3 π 2 7 π 4 2 π
r 0.785 1.57 3.14 4.71 5.50 6.28

Notice that the r -values are just the decimal form of the angle measured in radians. We can see them on a graph in [link] .

Graph of Archimedes' spiral r=theta over [0,2pi]. Starts at origin and spirals out in one loop counterclockwise. Points (pi/4, pi/4), (pi/2,pi/2), (pi,pi), (5pi/4, 5pi/4), (7pi/4, pi/4), and (2pi, 2pi) are marked.
Archimedes’ spiral
Got questions? Get instant answers now!

Questions & Answers

differentiate between demand and supply giving examples
Lambiv Reply
differentiated between demand and supply using examples
Lambiv
what is labour ?
Lambiv
how will I do?
Venny Reply
how is the graph works?I don't fully understand
Rezat Reply
information
Eliyee
devaluation
Eliyee
t
WARKISA
hi guys good evening to all
Lambiv
multiple choice question
Aster Reply
appreciation
Eliyee
explain perfect market
Lindiwe Reply
In economics, a perfect market refers to a theoretical construct where all participants have perfect information, goods are homogenous, there are no barriers to entry or exit, and prices are determined solely by supply and demand. It's an idealized model used for analysis,
Ezea
What is ceteris paribus?
Shukri Reply
other things being equal
AI-Robot
When MP₁ becomes negative, TP start to decline. Extuples Suppose that the short-run production function of certain cut-flower firm is given by: Q=4KL-0.6K2 - 0.112 • Where is quantity of cut flower produced, I is labour input and K is fixed capital input (K-5). Determine the average product of lab
Kelo
Extuples Suppose that the short-run production function of certain cut-flower firm is given by: Q=4KL-0.6K2 - 0.112 • Where is quantity of cut flower produced, I is labour input and K is fixed capital input (K-5). Determine the average product of labour (APL) and marginal product of labour (MPL)
Kelo
yes,thank you
Shukri
Can I ask you other question?
Shukri
what is monopoly mean?
Habtamu Reply
What is different between quantity demand and demand?
Shukri Reply
Quantity demanded refers to the specific amount of a good or service that consumers are willing and able to purchase at a give price and within a specific time period. Demand, on the other hand, is a broader concept that encompasses the entire relationship between price and quantity demanded
Ezea
ok
Shukri
how do you save a country economic situation when it's falling apart
Lilia Reply
what is the difference between economic growth and development
Fiker Reply
Economic growth as an increase in the production and consumption of goods and services within an economy.but Economic development as a broader concept that encompasses not only economic growth but also social & human well being.
Shukri
production function means
Jabir
What do you think is more important to focus on when considering inequality ?
Abdisa Reply
any question about economics?
Awais Reply
sir...I just want to ask one question... Define the term contract curve? if you are free please help me to find this answer 🙏
Asui
it is a curve that we get after connecting the pareto optimal combinations of two consumers after their mutually beneficial trade offs
Awais
thank you so much 👍 sir
Asui
In economics, the contract curve refers to the set of points in an Edgeworth box diagram where both parties involved in a trade cannot be made better off without making one of them worse off. It represents the Pareto efficient allocations of goods between two individuals or entities, where neither p
Cornelius
In economics, the contract curve refers to the set of points in an Edgeworth box diagram where both parties involved in a trade cannot be made better off without making one of them worse off. It represents the Pareto efficient allocations of goods between two individuals or entities,
Cornelius
Suppose a consumer consuming two commodities X and Y has The following utility function u=X0.4 Y0.6. If the price of the X and Y are 2 and 3 respectively and income Constraint is birr 50. A,Calculate quantities of x and y which maximize utility. B,Calculate value of Lagrange multiplier. C,Calculate quantities of X and Y consumed with a given price. D,alculate optimum level of output .
Feyisa Reply
Answer
Feyisa
c
Jabir
the market for lemon has 10 potential consumers, each having an individual demand curve p=101-10Qi, where p is price in dollar's per cup and Qi is the number of cups demanded per week by the i th consumer.Find the market demand curve using algebra. Draw an individual demand curve and the market dema
Gsbwnw Reply
suppose the production function is given by ( L, K)=L¼K¾.assuming capital is fixed find APL and MPL. consider the following short run production function:Q=6L²-0.4L³ a) find the value of L that maximizes output b)find the value of L that maximizes marginal product
Abdureman
types of unemployment
Yomi Reply
What is the difference between perfect competition and monopolistic competition?
Mohammed
Got questions? Join the online conversation and get instant answers!
Jobilize.com Reply
Practice Key Terms 9

Get Jobilize Job Search Mobile App in your pocket Now!

Get it on Google Play Download on the App Store Now


Source:  OpenStax, Algebra and trigonometry. OpenStax CNX. Nov 14, 2016 Download for free at https://legacy.cnx.org/content/col11758/1.6
Google Play and the Google Play logo are trademarks of Google Inc.

Notification Switch

Would you like to follow the 'Algebra and trigonometry' conversation and receive update notifications?

Ask