

| << Chapter < Page | Chapter >> Page > |
As with the sine and cosine functions, the tangent function can be described by a general equation.
We can identify horizontal and vertical stretches and compressions using values of and The horizontal stretch can typically be determined from the period of the graph. With tangent graphs, it is often necessary to determine a vertical stretch using a point on the graph.
Because there are no maximum or minimum values of a tangent function, the term amplitude cannot be interpreted as it is for the sine and cosine functions. Instead, we will use the phrase stretching/compressing factor when referring to the constant
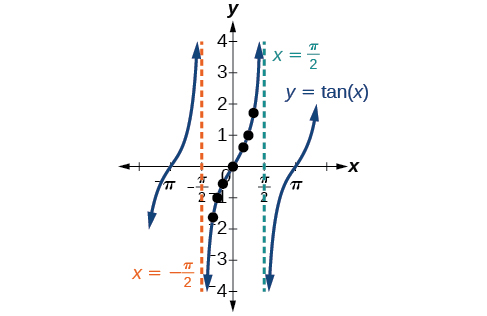
We can use what we know about the properties of the tangent function to quickly sketch a graph of any stretched and/or compressed tangent function of the form We focus on a single period of the function including the origin, because the periodic property enables us to extend the graph to the rest of the function’s domain if we wish. Our limited domain is then the interval and the graph has vertical asymptotes at where On the graph will come up from the left asymptote at cross through the origin, and continue to increase as it approaches the right asymptote at To make the function approach the asymptotes at the correct rate, we also need to set the vertical scale by actually evaluating the function for at least one point that the graph will pass through. For example, we can use
because
Given the function graph one period.
Sketch a graph of one period of the function
First, we identify and

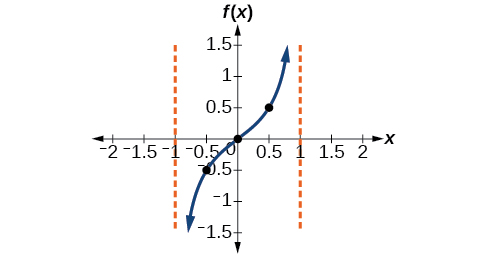
Because and we can find the stretching/compressing factor and period. The period is so the asymptotes are at At a quarter period from the origin, we have
This means the curve must pass through the points and The only inflection point is at the origin. [link] shows the graph of one period of the function.
Now that we can graph a tangent function that is stretched or compressed, we will add a vertical and/or horizontal (or phase) shift. In this case, we add and to the general form of the tangent function.
Notification Switch
Would you like to follow the 'Algebra and trigonometry' conversation and receive update notifications?

|
|
|
|
|

|
|

|
|

|
|

|
|

|
|

|
|
|
|
|

|
|
|
|
|

|
