<< Chapter < Page Chapter >> Page >

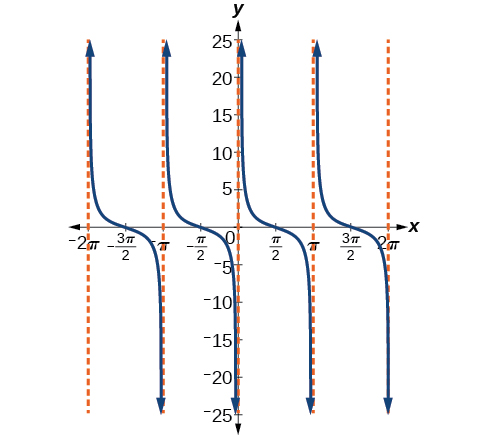
The cotangent graph has vertical asymptotes at each value of x where tan x = 0 ; we show these in the graph below with dashed lines. Since the cotangent is the reciprocal of the tangent, cot x has vertical asymptotes at all values of x where tan x = 0 , and cot x = 0 at all values of x where tan x has its vertical asymptotes.

A graph of cotangent of x, with vertical asymptotes at multiples of pi.
The cotangent function

Features of the graph of y = A Cot( Bx )

  • The stretching factor is | A | .
  • The period is P = π | B | .
  • The domain is x π | B | k , where k is an integer.
  • The range is ( , ) .
  • The asymptotes occur at x = π | B | k , where k is an integer.
  • y = A cot ( B x ) is an odd function.

Graphing variations of y = cot x

We can transform the graph of the cotangent in much the same way as we did for the tangent. The equation becomes the following.

y = A cot ( B x C ) + D

Properties of the graph of y = A Cot( Bx −c)+ D

  • The stretching factor is | A | .
  • The period is π | B | .
  • The domain is x C B + π | B | k , where k is an integer.
  • The range is ( −∞ , ) .
  • The vertical asymptotes occur at x = C B + π | B | k , where k is an integer.
  • There is no amplitude.
  • y = A cot ( B x ) is an odd function because it is the quotient of even and odd functions (cosine and sine, respectively)

Given a modified cotangent function of the form f ( x ) = A cot ( B x ) , graph one period.

  1. Express the function in the form f ( x ) = A cot ( B x ) .
  2. Identify the stretching factor, | A | .
  3. Identify the period, P = π | B | .
  4. Draw the graph of y = A tan ( B x ) .
  5. Plot any two reference points.
  6. Use the reciprocal relationship between tangent and cotangent to draw the graph of y = A cot ( B x ) .
  7. Sketch the asymptotes.

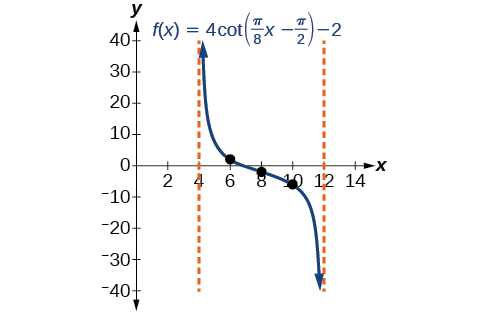
Graphing variations of the cotangent function

Determine the stretching factor, period, and phase shift of y = 3 cot ( 4 x ) , and then sketch a graph.

  • Step 1. Expressing the function in the form f ( x ) = A cot ( B x ) gives f ( x ) = 3 cot ( 4 x ) .
  • Step 2. The stretching factor is | A | = 3.
  • Step 3. The period is P = π 4 .
  • Step 4. Sketch the graph of y = 3 tan ( 4 x ) .
  • Step 5. Plot two reference points. Two such points are ( π 16 , 3 ) and ( 3 π 16 , −3 ) .
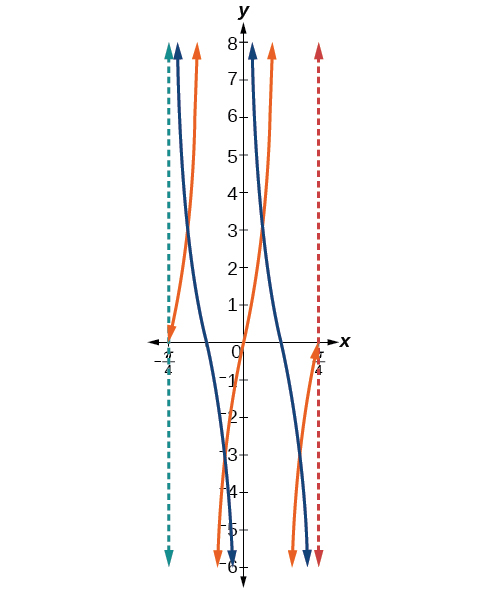
  • Step 6. Use the reciprocal relationship to draw y = 3 cot ( 4 x ) .
  • Step 7. Sketch the asymptotes, x = 0 , x = π 4 .

The orange graph in [link] shows y = 3 tan ( 4 x ) and the blue graph shows y = 3 cot ( 4 x ) .

A graph of two periods of a modified tangent function and a modified cotangent function. Vertical asymptotes at x=-pi/4 and pi/4.
Got questions? Get instant answers now!

Given a modified cotangent function of the form f ( x ) = A cot ( B x C ) + D , graph one period.

  1. Express the function in the form f ( x ) = A cot ( B x C ) + D .
  2. Identify the stretching factor, | A | .
  3. Identify the period, P = π | B | .
  4. Identify the phase shift, C B .
  5. Draw the graph of y = A tan ( B x ) shifted to the right by C B and up by D .
  6. Sketch the asymptotes x = C B + π | B | k , where k is an integer.
  7. Plot any three reference points and draw the graph through these points.

Graphing a modified cotangent

Sketch a graph of one period of the function f ( x ) = 4 cot ( π 8 x π 2 ) 2.

  • Step 1. The function is already written in the general form f ( x ) = A cot ( B x C ) + D .
  • Step 2. A = 4 , so the stretching factor is 4.
  • Step 3. B = π 8 , so the period is P = π | B | = π π 8 = 8.
  • Step 4. C = π 2 , so the phase shift is C B = π 2 π 8 = 4.
  • Step 5. We draw f ( x ) = 4 tan ( π 8 x π 2 ) 2.
  • Step 6-7. Three points we can use to guide the graph are ( 6 , 2 ) , ( 8 , 2 ) , and ( 10 , 6 ) . We use the reciprocal relationship of tangent and cotangent to draw f ( x ) = 4 cot ( π 8 x π 2 ) 2.
  • Step 8. The vertical asymptotes are x = 4 and x = 12.

The graph is shown in [link] .

A graph of one period of a modified cotangent function. Vertical asymptotes at x=4 and x=12.
One period of a modified cotangent function
Got questions? Get instant answers now!

Questions & Answers

how do you get the 2/50
Abba Reply
number of sport play by 50 student construct discrete data
Aminu Reply
width of the frangebany leaves on how to write a introduction
Theresa Reply
Solve the mean of variance
Veronica Reply
Step 1: Find the mean. To find the mean, add up all the scores, then divide them by the number of scores. ... Step 2: Find each score's deviation from the mean. ... Step 3: Square each deviation from the mean. ... Step 4: Find the sum of squares. ... Step 5: Divide the sum of squares by n – 1 or N.
kenneth
what is error
Yakuba Reply
Is mistake done to something
Vutshila
Hy
anas
hy
What is the life teble
anas
hy
Jibrin
statistics is the analyzing of data
Tajudeen Reply
what is statics?
Zelalem Reply
how do you calculate mean
Gloria Reply
diveving the sum if all values
Shaynaynay
let A1,A2 and A3 events be independent,show that (A1)^c, (A2)^c and (A3)^c are independent?
Fisaye Reply
what is statistics
Akhisani Reply
data collected all over the world
Shaynaynay
construct a less than and more than table
Imad Reply
The sample of 16 students is taken. The average age in the sample was 22 years with astandard deviation of 6 years. Construct a 95% confidence interval for the age of the population.
Aschalew Reply
Bhartdarshan' is an internet-based travel agency wherein customer can see videos of the cities they plant to visit. The number of hits daily is a normally distributed random variable with a mean of 10,000 and a standard deviation of 2,400 a. what is the probability of getting more than 12,000 hits? b. what is the probability of getting fewer than 9,000 hits?
Akshay Reply
Bhartdarshan'is an internet-based travel agency wherein customer can see videos of the cities they plan to visit. The number of hits daily is a normally distributed random variable with a mean of 10,000 and a standard deviation of 2,400. a. What is the probability of getting more than 12,000 hits
Akshay
1
Bright
Sorry i want to learn more about this question
Bright
Someone help
Bright
a= 0.20233 b=0.3384
Sufiyan
a
Shaynaynay
How do I interpret level of significance?
Mohd Reply
It depends on your business problem or in Machine Learning you could use ROC- AUC cruve to decide the threshold value
Shivam
how skewness and kurtosis are used in statistics
Owen Reply
yes what is it
Taneeya
Got questions? Join the online conversation and get instant answers!
Jobilize.com Reply

Get Jobilize Job Search Mobile App in your pocket Now!

Get it on Google Play Download on the App Store Now


Source:  OpenStax, Algebra and trigonometry. OpenStax CNX. Nov 14, 2016 Download for free at https://legacy.cnx.org/content/col11758/1.6
Google Play and the Google Play logo are trademarks of Google Inc.

Notification Switch

Would you like to follow the 'Algebra and trigonometry' conversation and receive update notifications?

Ask