<< Chapter < Page Chapter >> Page >

Given a logarithmic function, identify the domain.

  1. Set up an inequality showing the argument greater than zero.
  2. Solve for x .
  3. Write the domain in interval notation.

Identifying the domain of a logarithmic shift

What is the domain of f ( x ) = log 2 ( x + 3 ) ?

The logarithmic function is defined only when the input is positive, so this function is defined when x + 3 > 0. Solving this inequality,

x + 3 > 0 The input must be positive . x > 3 Subtract 3 .

The domain of f ( x ) = log 2 ( x + 3 ) is ( 3 , ) .

Got questions? Get instant answers now!

What is the domain of f ( x ) = log 5 ( x 2 ) + 1 ?

( 2 , )

Got questions? Get instant answers now!

Identifying the domain of a logarithmic shift and reflection

What is the domain of f ( x ) = log ( 5 2 x ) ?

The logarithmic function is defined only when the input is positive, so this function is defined when 5 2 x > 0 . Solving this inequality,

5 2 x > 0 The input must be positive . 2 x > 5 Subtract  5. x < 5 2 Divide by  2  and switch the inequality .

The domain of f ( x ) = log ( 5 2 x ) is ( , 5 2 ) .

Got questions? Get instant answers now!

What is the domain of f ( x ) = log ( x 5 ) + 2 ?

( 5 , )

Got questions? Get instant answers now!

Graphing logarithmic functions

Now that we have a feel for the set of values for which a logarithmic function is defined, we move on to graphing logarithmic functions. The family of logarithmic functions includes the parent function y = log b ( x ) along with all its transformations: shifts, stretches, compressions, and reflections.

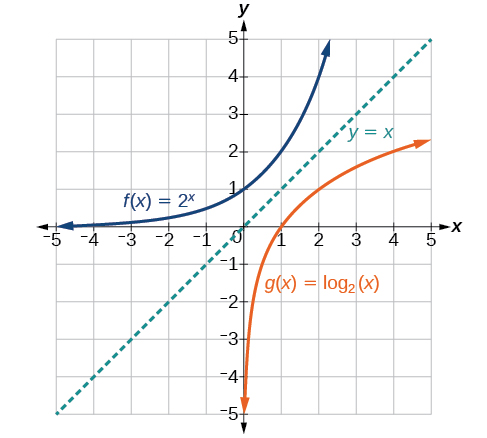
We begin with the parent function y = log b ( x ) . Because every logarithmic function of this form is the inverse of an exponential function with the form y = b x , their graphs will be reflections of each other across the line y = x . To illustrate this, we can observe the relationship between the input and output values of y = 2 x and its equivalent x = log 2 ( y ) in [link] .

x 3 2 1 0 1 2 3
2 x = y 1 8 1 4 1 2 1 2 4 8
log 2 ( y ) = x 3 2 1 0 1 2 3

Using the inputs and outputs from [link] , we can build another table to observe the relationship between points on the graphs of the inverse functions f ( x ) = 2 x and g ( x ) = log 2 ( x ) . See [link] .

f ( x ) = 2 x ( 3 , 1 8 ) ( 2 , 1 4 ) ( 1 , 1 2 ) ( 0 , 1 ) ( 1 , 2 ) ( 2 , 4 ) ( 3 , 8 )
g ( x ) = log 2 ( x ) ( 1 8 , 3 ) ( 1 4 , 2 ) ( 1 2 , 1 ) ( 1 , 0 ) ( 2 , 1 ) ( 4 , 2 ) ( 8 , 3 )

As we’d expect, the x - and y -coordinates are reversed for the inverse functions. [link] shows the graph of f and g .

Graph of two functions, f(x)=2^x and g(x)=log_2(x), with the line y=x denoting the axis of symmetry.
Notice that the graphs of f ( x ) = 2 x and g ( x ) = log 2 ( x ) are reflections about the line y = x .

Observe the following from the graph:

  • f ( x ) = 2 x has a y -intercept at ( 0 , 1 ) and g ( x ) = log 2 ( x ) has an x - intercept at ( 1 , 0 ) .
  • The domain of f ( x ) = 2 x , ( , ) , is the same as the range of g ( x ) = log 2 ( x ) .
  • The range of f ( x ) = 2 x , ( 0 , ) , is the same as the domain of g ( x ) = log 2 ( x ) .

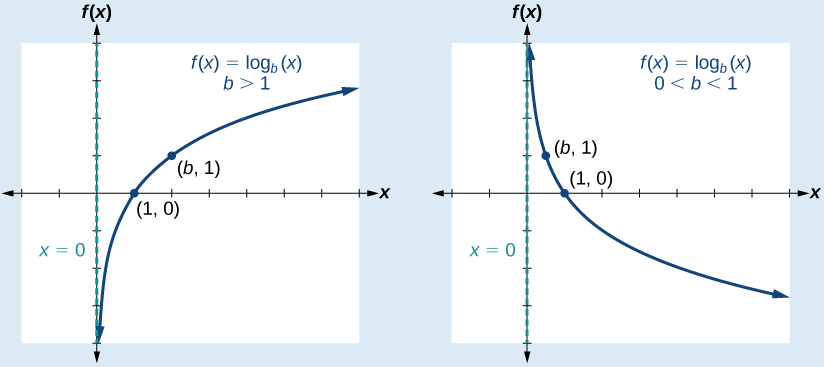
Characteristics of the graph of the parent function, f ( x ) = log b ( x )

For any real number x and constant b > 0 , b 1 , we can see the following characteristics in the graph of f ( x ) = log b ( x ) :

  • one-to-one function
  • vertical asymptote: x = 0
  • domain: ( 0 , )
  • range: ( , )
  • x- intercept: ( 1 , 0 ) and key point ( b , 1 )
  • y -intercept: none
  • increasing if b > 1
  • decreasing if 0 < b < 1

See [link] .

Two graphs of the function f(x)=log_b(x) with points (1,0) and (b, 1). The first graph shows the line when b>1, and the second graph shows the line when 0<b<1.

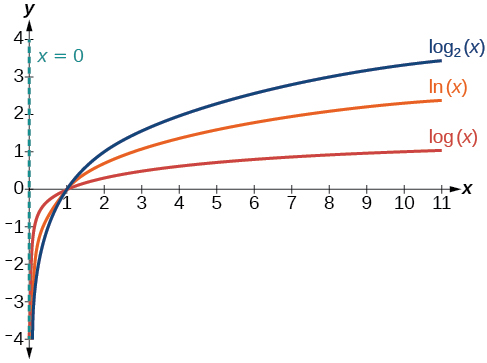
[link] shows how changing the base b in f ( x ) = log b ( x ) can affect the graphs. Observe that the graphs compress vertically as the value of the base increases. ( Note: recall that the function ln ( x ) has base e 2 . 718.)

Graph of three equations: y=log_2(x) in blue, y=ln(x) in orange, and y=log(x) in red. The y-axis is the asymptote.
The graphs of three logarithmic functions with different bases, all greater than 1.

Questions & Answers

how do you get the 2/50
Abba Reply
number of sport play by 50 student construct discrete data
Aminu Reply
width of the frangebany leaves on how to write a introduction
Theresa Reply
Solve the mean of variance
Veronica Reply
Step 1: Find the mean. To find the mean, add up all the scores, then divide them by the number of scores. ... Step 2: Find each score's deviation from the mean. ... Step 3: Square each deviation from the mean. ... Step 4: Find the sum of squares. ... Step 5: Divide the sum of squares by n – 1 or N.
kenneth
what is error
Yakuba Reply
Is mistake done to something
Vutshila
Hy
anas
hy
What is the life teble
anas
hy
Jibrin
statistics is the analyzing of data
Tajudeen Reply
what is statics?
Zelalem Reply
how do you calculate mean
Gloria Reply
diveving the sum if all values
Shaynaynay
let A1,A2 and A3 events be independent,show that (A1)^c, (A2)^c and (A3)^c are independent?
Fisaye Reply
what is statistics
Akhisani Reply
data collected all over the world
Shaynaynay
construct a less than and more than table
Imad Reply
The sample of 16 students is taken. The average age in the sample was 22 years with astandard deviation of 6 years. Construct a 95% confidence interval for the age of the population.
Aschalew Reply
Bhartdarshan' is an internet-based travel agency wherein customer can see videos of the cities they plant to visit. The number of hits daily is a normally distributed random variable with a mean of 10,000 and a standard deviation of 2,400 a. what is the probability of getting more than 12,000 hits? b. what is the probability of getting fewer than 9,000 hits?
Akshay Reply
Bhartdarshan'is an internet-based travel agency wherein customer can see videos of the cities they plan to visit. The number of hits daily is a normally distributed random variable with a mean of 10,000 and a standard deviation of 2,400. a. What is the probability of getting more than 12,000 hits
Akshay
1
Bright
Sorry i want to learn more about this question
Bright
Someone help
Bright
a= 0.20233 b=0.3384
Sufiyan
a
Shaynaynay
How do I interpret level of significance?
Mohd Reply
It depends on your business problem or in Machine Learning you could use ROC- AUC cruve to decide the threshold value
Shivam
how skewness and kurtosis are used in statistics
Owen Reply
yes what is it
Taneeya
Got questions? Join the online conversation and get instant answers!
Jobilize.com Reply

Get Jobilize Job Search Mobile App in your pocket Now!

Get it on Google Play Download on the App Store Now


Source:  OpenStax, Algebra and trigonometry. OpenStax CNX. Nov 14, 2016 Download for free at https://legacy.cnx.org/content/col11758/1.6
Google Play and the Google Play logo are trademarks of Google Inc.

Notification Switch

Would you like to follow the 'Algebra and trigonometry' conversation and receive update notifications?

Ask