<< Chapter < Page Chapter >> Page >

Given a logarithmic function, identify the domain.

  1. Set up an inequality showing the argument greater than zero.
  2. Solve for x .
  3. Write the domain in interval notation.

Identifying the domain of a logarithmic shift

What is the domain of f ( x ) = log 2 ( x + 3 ) ?

The logarithmic function is defined only when the input is positive, so this function is defined when x + 3 > 0. Solving this inequality,

x + 3 > 0 The input must be positive . x > 3 Subtract 3 .

The domain of f ( x ) = log 2 ( x + 3 ) is ( 3 , ) .

Got questions? Get instant answers now!

What is the domain of f ( x ) = log 5 ( x 2 ) + 1 ?

( 2 , )

Got questions? Get instant answers now!

Identifying the domain of a logarithmic shift and reflection

What is the domain of f ( x ) = log ( 5 2 x ) ?

The logarithmic function is defined only when the input is positive, so this function is defined when 5 2 x > 0 . Solving this inequality,

5 2 x > 0 The input must be positive . 2 x > 5 Subtract  5. x < 5 2 Divide by  2  and switch the inequality .

The domain of f ( x ) = log ( 5 2 x ) is ( , 5 2 ) .

Got questions? Get instant answers now!

What is the domain of f ( x ) = log ( x 5 ) + 2 ?

( 5 , )

Got questions? Get instant answers now!

Graphing logarithmic functions

Now that we have a feel for the set of values for which a logarithmic function is defined, we move on to graphing logarithmic functions. The family of logarithmic functions includes the parent function y = log b ( x ) along with all its transformations: shifts, stretches, compressions, and reflections.

We begin with the parent function y = log b ( x ) . Because every logarithmic function of this form is the inverse of an exponential function with the form y = b x , their graphs will be reflections of each other across the line y = x . To illustrate this, we can observe the relationship between the input and output values of y = 2 x and its equivalent x = log 2 ( y ) in [link] .

x 3 2 1 0 1 2 3
2 x = y 1 8 1 4 1 2 1 2 4 8
log 2 ( y ) = x 3 2 1 0 1 2 3

Using the inputs and outputs from [link] , we can build another table to observe the relationship between points on the graphs of the inverse functions f ( x ) = 2 x and g ( x ) = log 2 ( x ) . See [link] .

f ( x ) = 2 x ( 3 , 1 8 ) ( 2 , 1 4 ) ( 1 , 1 2 ) ( 0 , 1 ) ( 1 , 2 ) ( 2 , 4 ) ( 3 , 8 )
g ( x ) = log 2 ( x ) ( 1 8 , 3 ) ( 1 4 , 2 ) ( 1 2 , 1 ) ( 1 , 0 ) ( 2 , 1 ) ( 4 , 2 ) ( 8 , 3 )

As we’d expect, the x - and y -coordinates are reversed for the inverse functions. 
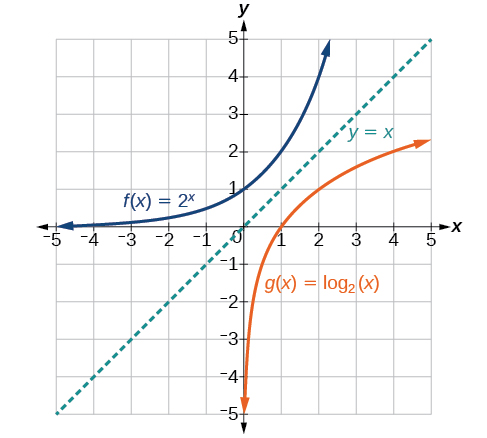
[link] shows the graph of f and g .

Graph of two functions, f(x)=2^x and g(x)=log_2(x), with the line y=x denoting the axis of symmetry.
Notice that the graphs of f ( x ) = 2 x and g ( x ) = log 2 ( x ) are reflections about the line y = x .

Observe the following from the graph:

  • f ( x ) = 2 x has a y -intercept at ( 0 , 1 ) and g ( x ) = log 2 ( x ) has an x - intercept at ( 1 , 0 ) .
  • The domain of f ( x ) = 2 x , ( , ) , is the same as the range of g ( x ) = log 2 ( x ) .
  • The range of f ( x ) = 2 x , ( 0 , ) , is the same as the domain of g ( x ) = log 2 ( x ) .

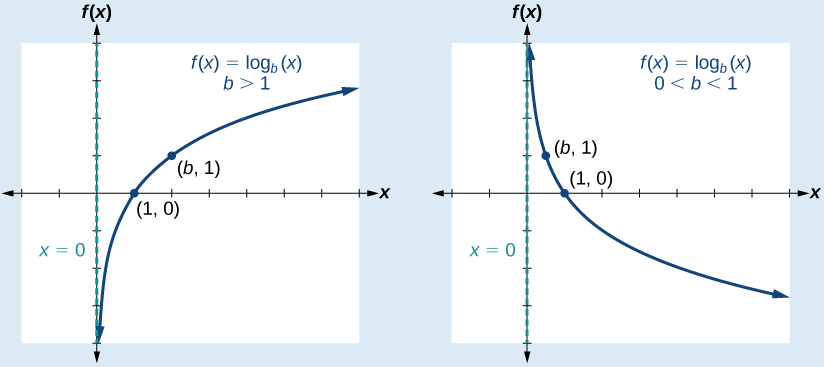
Characteristics of the graph of the parent function, f ( x ) = log b ( x )

For any real number x and constant b > 0 , b 1 , we can see the following characteristics in the graph of f ( x ) = log b ( x ) :

  • one-to-one function
  • vertical asymptote: x = 0
  • domain: ( 0 , )
  • range: ( , )
  • x- intercept: ( 1 , 0 ) and key point ( b , 1 )
  • y -intercept: none
  • increasing if b > 1
  • decreasing if 0 < b < 1

See [link] .

Two graphs of the function f(x)=log_b(x) with points (1,0) and (b, 1). The first graph shows the line when b>1, and the second graph shows the line when 0<b<1.

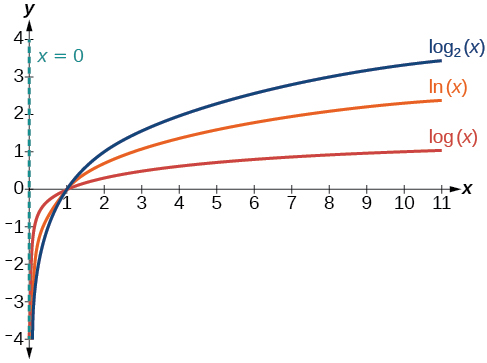
[link] shows how changing the base b in f ( x ) = log b ( x ) can affect the graphs. Observe that the graphs compress vertically as the value of the base increases. ( Note: recall that the function ln ( x ) has base e 2 . 718.)

Graph of three equations: y=log_2(x) in blue, y=ln(x) in orange, and y=log(x) in red. The y-axis is the asymptote.
The graphs of three logarithmic functions with different bases, all greater than 1.

Questions & Answers

what is biology
Hajah Reply
the study of living organisms and their interactions with one another and their environments
AI-Robot
what is biology
Victoria Reply
HOW CAN MAN ORGAN FUNCTION
Alfred Reply
the diagram of the digestive system
Assiatu Reply
allimentary cannel
Ogenrwot
How does twins formed
William Reply
They formed in two ways first when one sperm and one egg are splited by mitosis or two sperm and two eggs join together
Oluwatobi
what is genetics
Josephine Reply
Genetics is the study of heredity
Misack
how does twins formed?
Misack
What is manual
Hassan Reply
discuss biological phenomenon and provide pieces of evidence to show that it was responsible for the formation of eukaryotic organelles
Joseph Reply
what is biology
Yousuf Reply
the study of living organisms and their interactions with one another and their environment.
Wine
discuss the biological phenomenon and provide pieces of evidence to show that it was responsible for the formation of eukaryotic organelles in an essay form
Joseph Reply
what is the blood cells
Shaker Reply
list any five characteristics of the blood cells
Shaker
lack electricity and its more savely than electronic microscope because its naturally by using of light
Abdullahi Reply
advantage of electronic microscope is easily and clearly while disadvantage is dangerous because its electronic. advantage of light microscope is savely and naturally by sun while disadvantage is not easily,means its not sharp and not clear
Abdullahi
cell theory state that every organisms composed of one or more cell,cell is the basic unit of life
Abdullahi
is like gone fail us
DENG
cells is the basic structure and functions of all living things
Ramadan
What is classification
ISCONT Reply
is organisms that are similar into groups called tara
Yamosa
in what situation (s) would be the use of a scanning electron microscope be ideal and why?
Kenna Reply
A scanning electron microscope (SEM) is ideal for situations requiring high-resolution imaging of surfaces. It is commonly used in materials science, biology, and geology to examine the topography and composition of samples at a nanoscale level. SEM is particularly useful for studying fine details,
Hilary
cell is the building block of life.
Condoleezza Reply
Got questions? Join the online conversation and get instant answers!
Jobilize.com Reply

Get Jobilize Job Search Mobile App in your pocket Now!

Get it on Google Play Download on the App Store Now


Source:  OpenStax, Algebra and trigonometry. OpenStax CNX. Nov 14, 2016 Download for free at https://legacy.cnx.org/content/col11758/1.6
Google Play and the Google Play logo are trademarks of Google Inc.

Notification Switch

Would you like to follow the 'Algebra and trigonometry' conversation and receive update notifications?

Ask