<< Chapter < Page Chapter >> Page >

Shifts of the parent function f ( x ) = b x

For any constants c and d , the function f ( x ) = b x + c + d shifts the parent function f ( x ) = b x

  • vertically d units, in the same direction of the sign of d .
  • horizontally c units, in the opposite direction of the sign of c .
  • The y -intercept becomes ( 0 , b c + d ) .
  • The horizontal asymptote becomes y = d .
  • The range becomes ( d , ) .
  • The domain, ( , ) , remains unchanged.

Given an exponential function with the form f ( x ) = b x + c + d , graph the translation.

  1. Draw the horizontal asymptote y = d .
  2. Identify the shift as ( c , d ) . Shift the graph of f ( x ) = b x left c units if c is positive, and right c units if c is negative.
  3. Shift the graph of f ( x ) = b x up d units if d is positive, and down d units if d is negative.
  4. State the domain, ( , ) , the range, ( d , ) , and the horizontal asymptote y = d .

Graphing a shift of an exponential function

Graph f ( x ) = 2 x + 1 3. State the domain, range, and asymptote.

We have an exponential equation of the form f ( x ) = b x + c + d , with b = 2 , c = 1 , and d = 3.

Draw the horizontal asymptote y = d , so draw y = −3.

Identify the shift as ( c , d ) , so the shift is ( 1 , −3 ) .

Shift the graph of f ( x ) = b x left 1 units and down 3 units.

Graph of the function, f(x) = 2^(x+1)-3, with an asymptote at y=-3. Labeled points in the graph are (-1, -2), (0, -1), and (1, 1).

The domain is ( , ) ; the range is ( 3 , ) ; the horizontal asymptote is y = −3.

Got questions? Get instant answers now!

Graph f ( x ) = 2 x 1 + 3. State domain, range, and asymptote.

The domain is ( , ) ; the range is ( 3 , ) ; the horizontal asymptote is y = 3.

Graph of the function, f(x) = 2^(x-1)+3, with an asymptote at y=3. Labeled points in the graph are (-1, 3.25), (0, 3.5), and (1, 4).
Got questions? Get instant answers now!

Given an equation of the form f ( x ) = b x + c + d for x , use a graphing calculator to approximate the solution.

  • Press [Y=] . Enter the given exponential equation in the line headed “ Y 1 = ”.
  • Enter the given value for f ( x ) in the line headed “ Y 2 = ”.
  • Press [WINDOW] . Adjust the y -axis so that it includes the value entered for “ Y 2 = ”.
  • Press [GRAPH] to observe the graph of the exponential function along with the line for the specified value of f ( x ) .
  • To find the value of x , we compute the point of intersection. Press [2ND] then [CALC] . Select “intersect” and press [ENTER] three times. The point of intersection gives the value of x for the indicated value of the function.

Approximating the solution of an exponential equation

Solve 42 = 1.2 ( 5 ) x + 2.8 graphically. Round to the nearest thousandth.

Press [Y=] and enter 1.2 ( 5 ) x + 2.8 next to Y 1 =. Then enter 42 next to Y2= . For a window, use the values –3 to 3 for x and –5 to 55 for y . Press [GRAPH] . The graphs should intersect somewhere near x = 2.

For a better approximation, press [2ND] then [CALC] . Select [5: intersect] and press [ENTER] three times. The x -coordinate of the point of intersection is displayed as 2.1661943. (Your answer may be different if you use a different window or use a different value for Guess? ) To the nearest thousandth, x 2.166.

Got questions? Get instant answers now!

Solve 4 = 7.85 ( 1.15 ) x 2.27 graphically. Round to the nearest thousandth.

x 1.608

Got questions? Get instant answers now!

Graphing a stretch or compression

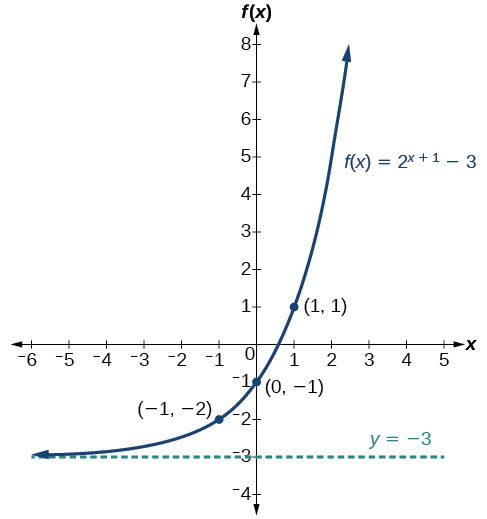
While horizontal and vertical shifts involve adding constants to the input or to the function itself, a stretch or compression occurs when we multiply the parent function f ( x ) = b x by a constant | a | > 0. For example, if we begin by graphing the parent function f ( x ) = 2 x , we can then graph the stretch, using a = 3 , to get g ( x ) = 3 ( 2 ) x as shown on the left in 
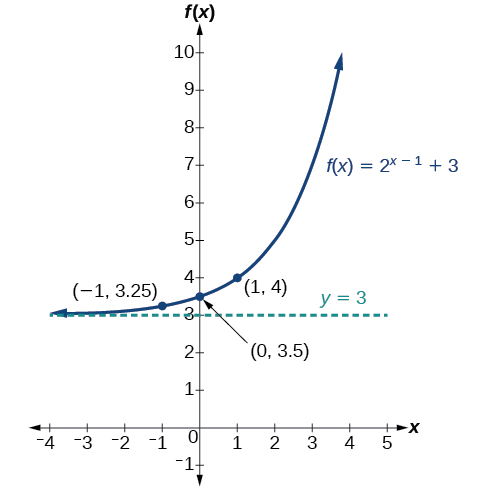
[link] , and the compression, using a = 1 3 , to get h ( x ) = 1 3 ( 2 ) x as shown on the right in [link] .

Questions & Answers

how do you get the 2/50
Abba Reply
number of sport play by 50 student construct discrete data
Aminu Reply
width of the frangebany leaves on how to write a introduction
Theresa Reply
Solve the mean of variance
Veronica Reply
Step 1: Find the mean. To find the mean, add up all the scores, then divide them by the number of scores. ... Step 2: Find each score's deviation from the mean. ... Step 3: Square each deviation from the mean. ... Step 4: Find the sum of squares. ... Step 5: Divide the sum of squares by n – 1 or N.
kenneth
what is error
Yakuba Reply
Is mistake done to something
Vutshila
Hy
anas
hy
What is the life teble
anas
hy
Jibrin
statistics is the analyzing of data
Tajudeen Reply
what is statics?
Zelalem Reply
how do you calculate mean
Gloria Reply
diveving the sum if all values
Shaynaynay
let A1,A2 and A3 events be independent,show that (A1)^c, (A2)^c and (A3)^c are independent?
Fisaye Reply
what is statistics
Akhisani Reply
data collected all over the world
Shaynaynay
construct a less than and more than table
Imad Reply
The sample of 16 students is taken. The average age in the sample was 22 years with astandard deviation of 6 years. Construct a 95% confidence interval for the age of the population.
Aschalew Reply
Bhartdarshan' is an internet-based travel agency wherein customer can see videos of the cities they plant to visit. The number of hits daily is a normally distributed random variable with a mean of 10,000 and a standard deviation of 2,400 a. what is the probability of getting more than 12,000 hits? b. what is the probability of getting fewer than 9,000 hits?
Akshay Reply
Bhartdarshan'is an internet-based travel agency wherein customer can see videos of the cities they plan to visit. The number of hits daily is a normally distributed random variable with a mean of 10,000 and a standard deviation of 2,400. a. What is the probability of getting more than 12,000 hits
Akshay
1
Bright
Sorry i want to learn more about this question
Bright
Someone help
Bright
a= 0.20233 b=0.3384
Sufiyan
a
Shaynaynay
How do I interpret level of significance?
Mohd Reply
It depends on your business problem or in Machine Learning you could use ROC- AUC cruve to decide the threshold value
Shivam
how skewness and kurtosis are used in statistics
Owen Reply
yes what is it
Taneeya
Got questions? Join the online conversation and get instant answers!
Jobilize.com Reply

Get Jobilize Job Search Mobile App in your pocket Now!

Get it on Google Play Download on the App Store Now


Source:  OpenStax, Algebra and trigonometry. OpenStax CNX. Nov 14, 2016 Download for free at https://legacy.cnx.org/content/col11758/1.6
Google Play and the Google Play logo are trademarks of Google Inc.

Notification Switch

Would you like to follow the 'Algebra and trigonometry' conversation and receive update notifications?

Ask