

| << Chapter < Page | Chapter >> Page > |
The other characteristic of the linear function is its slope .
Let’s consider the following function.
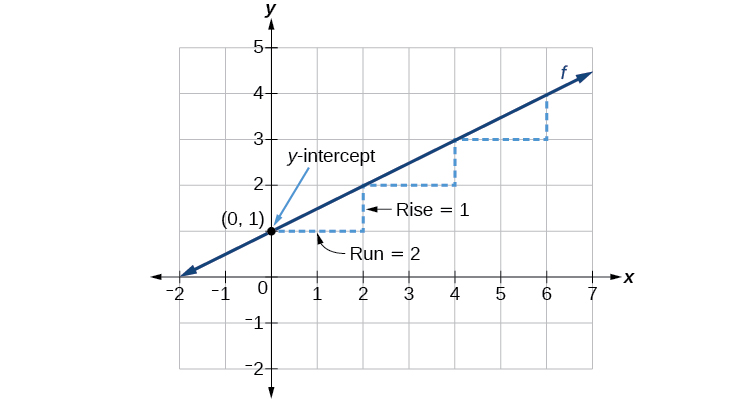
The slope is Because the slope is positive, we know the graph will slant upward from left to right. The y- intercept is the point on the graph when The graph crosses the y -axis at Now we know the slope and the y -intercept. We can begin graphing by plotting the point We know that the slope is the change in the y -coordinate over the change in the x -coordinate. This is commonly referred to as rise over run, From our example, we have which means that the rise is 1 and the run is 2. So starting from our y -intercept we can rise 1 and then run 2, or run 2 and then rise 1. We repeat until we have a few points, and then we draw a line through the points as shown in [link] .
In the equation
Do all linear functions have y -intercepts?
Yes. All linear functions cross the y-axis and therefore have y-intercepts. (Note: A vertical line is parallel to the y-axis does not have a y-intercept, but it is not a function .)
Given the equation for a linear function, graph the function using the y -intercept and slope.
Graph using the y- intercept and slope.
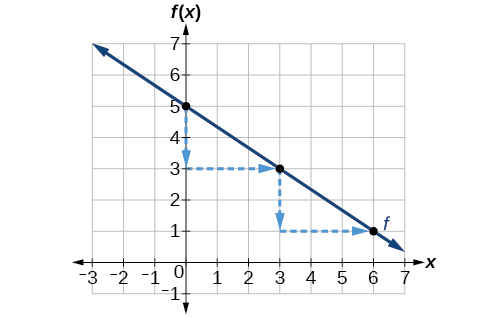
Evaluate the function at to find the y- intercept. The output value when is 5, so the graph will cross the y -axis at
According to the equation for the function, the slope of the line is This tells us that for each vertical decrease in the “rise” of units, the “run” increases by 3 units in the horizontal direction. We can now graph the function by first plotting the y -intercept on the graph in [link] . From the initial value we move down 2 units and to the right 3 units. We can extend the line to the left and right by repeating, and then drawing a line through the points.
Find a point on the graph we drew in [link] that has a negative x -value.
Possible answers include or
Another option for graphing is to use a transformation of the identity function A function may be transformed by a shift up, down, left, or right. A function may also be transformed using a reflection, stretch, or compression.
Notification Switch
Would you like to follow the 'Algebra and trigonometry' conversation and receive update notifications?

|
|
|
|
|

|
|

|
|

|
|

|
|

|
|

|
|

|
|
|
|
|
|
|

|