<< Chapter < Page Chapter >> Page >

A regression was run to determine whether there is a relationship between the diameter of a tree ( x , in inches) and the tree’s age ( y , in years). The results of the regression are given below. Use this to predict the age of a tree with diameter 10 inches.

y = a x + b a = 6.301 b = −1.044   r = −0.970

61.966 years

Got questions? Get instant answers now!

For the following exercises, draw a scatter plot for the data provided. Does the data appear to be linearly related?

0 2 4 6 8 10
–22 –19 –15 –11 –6 –2
Got questions? Get instant answers now!
1 2 3 4 5 6
46 50 59 75 100 136
Scatter plot with a collection of points appearing at (1,46); (2,50); (3,59); (4,75); (5, 100); and (6,136); they do not appear linear

No.

Got questions? Get instant answers now!
100 250 300 450 600 750
12 12.6 13.1 14 14.5 15.2
Got questions? Get instant answers now!
1 3 5 7 9 11
1 9 28 65 125 216
Scatterplot with a collection of points at (1,1); (3,9); (5,28); (7,65); (9,125); and (11,216); they do not appear linear

No.

Got questions? Get instant answers now!

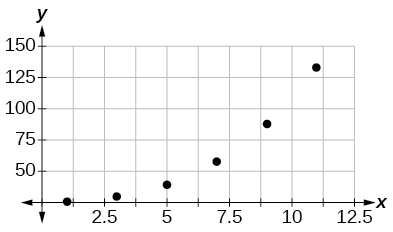
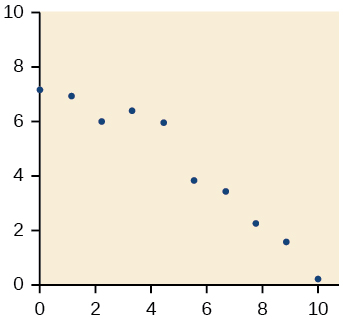
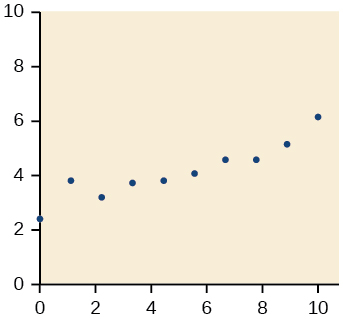
For the following data, draw a scatter plot. If we wanted to know when the population would reach 15,000, would the answer involve interpolation or extrapolation? Eyeball the line, and estimate the answer.

Year Population
1990 11,500
1995 12,100
2000 12,700
2005 13,000
2010 13,750
Got questions? Get instant answers now!

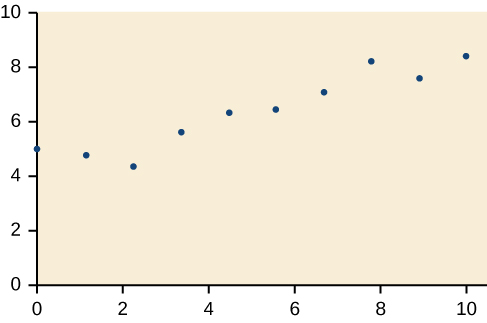
For the following data, draw a scatter plot. If we wanted to know when the temperature would reach 28°F, would the answer involve interpolation or extrapolation? Eyeball the line and estimate the answer.

Temperature,°F 16 18 20 25 30
Time, seconds 46 50 54 55 62
Scatterplot with a collection of points at (16,46); (18,50); (20,54); (25,55); and (30,62); they appear nonlinear

Interpolation. About 60 ° F .

Got questions? Get instant answers now!

Graphical

For the following exercises, match each scatterplot with one of the four specified correlations in [link] and [link] .

Side-by-side scatter plots.  The first is a scattered correlation in the positive direction.  The second is a scattered correlation in the negative direction
Side-by-side scatter plots.  The first has a strong negative correlation with all the points spaced out evenly near the top and center, but more spread out near the bottom.  The second has a strong positive correlation, with the points more spread out near the bottom and closer together near the center and top.

r = −0. 89

This value of r indicates a strong negative correlation or slope, so C

Got questions? Get instant answers now!

r = −0.39

This value of r indicates a weak negative correlation, so B

Got questions? Get instant answers now!

For the following exercises, draw a best-fit line for the plotted data.

Numeric

The U.S. Census tracks the percentage of persons 25 years or older who are college graduates. That data for several years is given in [link] . Based on data from http://www.census.gov/hhes/socdemo/education/data/cps/historical/index.html. Accessed 5/1/2014. Determine whether the trend appears linear. If so, and assuming the trend continues, in what year will the percentage exceed 35%?

Year Percent Graduates
1990 21.3
1992 21.4
1994 22.2
1996 23.6
1998 24.4
2000 25.6
2002 26.7
2004 27.7
2006 28
2008 29.4
Got questions? Get instant answers now!

The U.S. import of wine (in hectoliters) for several years is given in [link] . Determine whether the trend appears linear. If so, and assuming the trend continues, in what year will imports exceed 12,000 hectoliters?

Year Imports
1992 2665
1994 2688
1996 3565
1998 4129
2000 4584
2002 5655
2004 6549
2006 7950
2008 8487
2009 9462

Yes, trend appears linear because r = 0. 985 and will exceed 12,000 near midyear, 2016, 24.6 years since 1992.

Got questions? Get instant answers now!

[link] shows the year and the number of people unemployed in a particular city for several years. Determine whether the trend appears linear. If so, and assuming the trend continues, in what year will the number of unemployed reach 5?

Year Number Unemployed
1990 750
1992 670
1994 650
1996 605
1998 550
2000 510
2002 460
2004 420
2006 380
2008 320
Got questions? Get instant answers now!

Technology

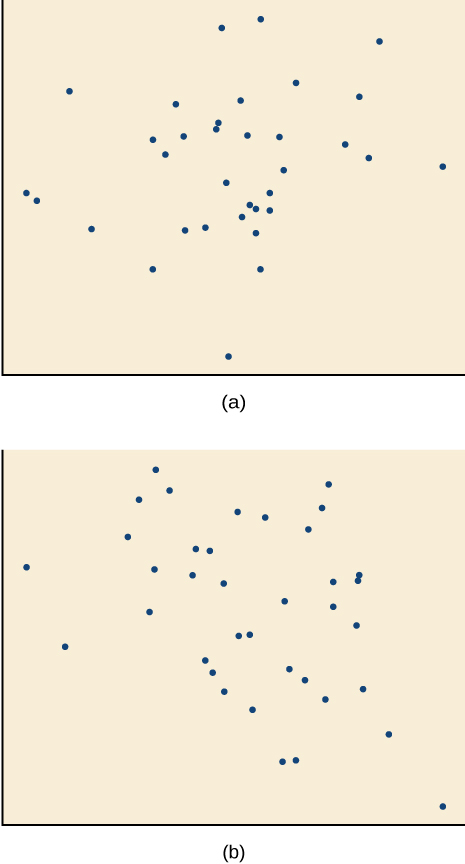
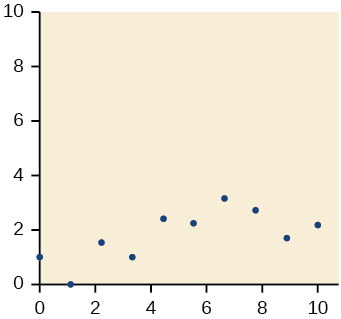
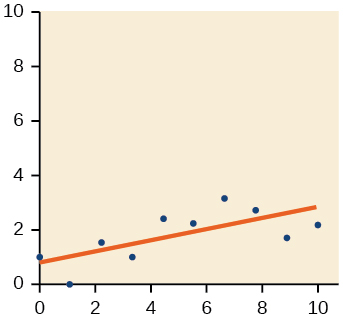
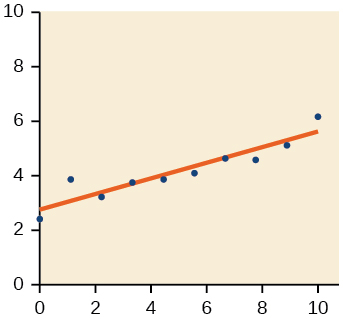
For the following exercises, use each set of data to calculate the regression line using a calculator or other technology tool, and determine the correlation coefficient to 3 decimal places of accuracy.

x 8 15 26 31 56
y 23 41 53 72 103

y = 1 . 64 0 x + 13 . 8 00 , r = 0. 987

Got questions? Get instant answers now!
x 5 7 10 12 15
y 4 12 17 22 24
Got questions? Get instant answers now!
x y x y
3 21.9 10 18.54
4 22.22 11 15.76
5 22.74 12 13.68
6 22.26 13 14.1
7 20.78 14 14.02
8 17.6 15 11.94
9 16.52 16 12.76

y = 0.962 x + 26.86 ,       r = 0.965

Got questions? Get instant answers now!

Questions & Answers

Discuss the differences between taste and flavor, including how other sensory inputs contribute to our  perception of flavor.
John Reply
taste refers to your understanding of the flavor . while flavor one The other hand is refers to sort of just a blend things.
Faith
While taste primarily relies on our taste buds, flavor involves a complex interplay between taste and aroma
Kamara
which drugs can we use for ulcers
Ummi Reply
omeprazole
Kamara
what
Renee
what is this
Renee
is a drug
Kamara
of anti-ulcer
Kamara
Omeprazole Cimetidine / Tagament For the complicated once ulcer - kit
Patrick
what is the function of lymphatic system
Nency Reply
Not really sure
Eli
to drain extracellular fluid all over the body.
asegid
The lymphatic system plays several crucial roles in the human body, functioning as a key component of the immune system and contributing to the maintenance of fluid balance. Its main functions include: 1. Immune Response: The lymphatic system produces and transports lymphocytes, which are a type of
asegid
to transport fluids fats proteins and lymphocytes to the blood stream as lymph
Adama
what is anatomy
Oyindarmola Reply
Anatomy is the identification and description of the structures of living things
Kamara
what's the difference between anatomy and physiology
Oyerinde Reply
Anatomy is the study of the structure of the body, while physiology is the study of the function of the body. Anatomy looks at the body's organs and systems, while physiology looks at how those organs and systems work together to keep the body functioning.
AI-Robot
what is enzymes all about?
Mohammed Reply
Enzymes are proteins that help speed up chemical reactions in our bodies. Enzymes are essential for digestion, liver function and much more. Too much or too little of a certain enzyme can cause health problems
Kamara
yes
Prince
how does the stomach protect itself from the damaging effects of HCl
Wulku Reply
little girl okay how does the stomach protect itself from the damaging effect of HCL
Wulku
it is because of the enzyme that the stomach produce that help the stomach from the damaging effect of HCL
Kamara
function of digestive system
Ali Reply
function of digestive
Ali
the diagram of the lungs
Adaeze Reply
what is the normal body temperature
Diya Reply
37 degrees selcius
Xolo
37°c
Stephanie
please why 37 degree selcius normal temperature
Mark
36.5
Simon
37°c
Iyogho
the normal temperature is 37°c or 98.6 °Fahrenheit is important for maintaining the homeostasis in the body the body regular this temperature through the process called thermoregulation which involves brain skin muscle and other organ working together to maintain stable internal temperature
Stephanie
37A c
Wulku
what is anaemia
Diya Reply
anaemia is the decrease in RBC count hemoglobin count and PVC count
Eniola
what is the pH of the vagina
Diya Reply
how does Lysin attack pathogens
Diya
acid
Mary
I information on anatomy position and digestive system and there enzyme
Elisha Reply
anatomy of the female external genitalia
Muhammad Reply
Organ Systems Of The Human Body (Continued) Organ Systems Of The Human Body (Continued)
Theophilus Reply
what's lochia albra
Kizito
Got questions? Join the online conversation and get instant answers!
Jobilize.com Reply
Practice Key Terms 5

Get Jobilize Job Search Mobile App in your pocket Now!

Get it on Google Play Download on the App Store Now


Source:  OpenStax, Algebra and trigonometry. OpenStax CNX. Nov 14, 2016 Download for free at https://legacy.cnx.org/content/col11758/1.6
Google Play and the Google Play logo are trademarks of Google Inc.

Notification Switch

Would you like to follow the 'Algebra and trigonometry' conversation and receive update notifications?

Ask