| << Chapter < Page | Chapter >> Page > |
The graph of a transformed tangent function is different from the basic tangent function in several ways:
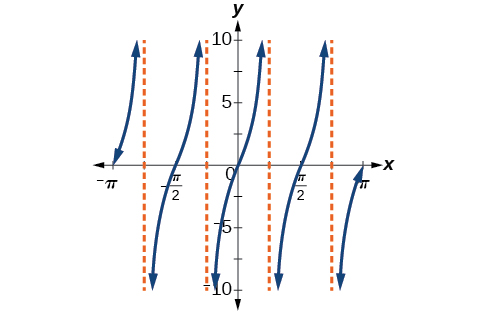
Given the function sketch the graph of one period.
Graph one period of the function
How would the graph in [link] look different if we made instead of
It would be reflected across the line becoming an increasing function.
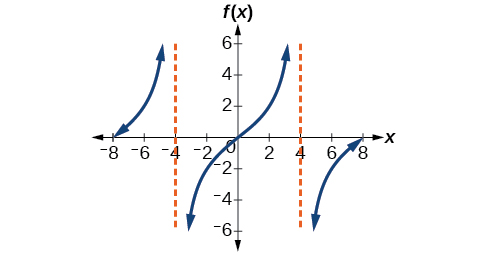
Given the graph of a tangent function, identify horizontal and vertical stretches.
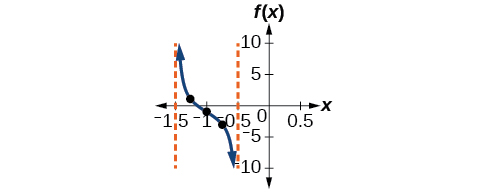
Find a formula for the function graphed in [link] .
The graph has the shape of a tangent function.
Because
This function would have a formula
The secant was defined by the reciprocal identity Notice that the function is undefined when the cosine is 0, leading to vertical asymptotes at etc. Because the cosine is never more than 1 in absolute value, the secant, being the reciprocal, will never be less than 1 in absolute value.
We can graph by observing the graph of the cosine function because these two functions are reciprocals of one another. See [link] . The graph of the cosine is shown as a dashed orange wave so we can see the relationship. Where the graph of the cosine function decreases, the graph of the secant function increases. Where the graph of the cosine function increases, the graph of the secant function decreases. When the cosine function is zero, the secant is undefined.
Notification Switch
Would you like to follow the 'Algebra and trigonometry' conversation and receive update notifications?

|
|
|
|
|

|
|

|
|

|
|

|
|

|
|

|
|

|
|
|
|
|

|
|
|
|