<< Chapter < Page Chapter >> Page >

Sketch the graph of r = 3 2 cos θ .

Graph of the limaçon r=3-2cos(theta). Extending to the left.
Got questions? Get instant answers now!

Another type of limaçon, the inner-loop limaçon , is named for the loop formed inside the general limaçon shape. It was discovered by the German artist Albrecht Dürer (1471-1528), who revealed a method for drawing the inner-loop limaçon in his 1525 book Underweysung der Messing . A century later, the father of mathematician Blaise Pascal , Étienne Pascal(1588-1651), rediscovered it.

Formulas for inner-loop limaçons

The formulas that generate the inner-loop limaçons are given by r = a ± b cos θ and r = a ± b sin θ where a > 0 , b > 0 , and a < b . The graph of the inner-loop limaçon passes through the pole twice: once for the outer loop, and once for the inner loop. See [link] for the graphs.

Graph of four inner loop limaçons side by side. (A) is r=a+bcos(theta),a<b. Extended to the right. (B) is a-bcos(theta), a<b. Extends to the left. (C) is r=a+bsin(theta), a<b. Extends up. (D) is r=a-bsin(theta), a<b. Extends down.

Sketching the graph of an inner-loop limaçon

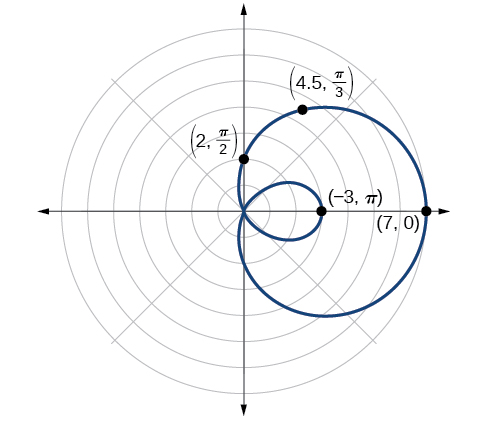
Sketch the graph of r = 2 + 5 cos θ .

Testing for symmetry, we find that the graph of the equation is symmetric about the polar axis. Next, finding the zeros reveals that when r = 0 , θ = 1.98. The maximum | r | is found when cos θ = 1 or when θ = 0. Thus, the maximum is found at the point (7, 0).

Even though we have found symmetry, the zero, and the maximum, plotting more points will help to define the shape, and then a pattern will emerge.

See [link] .

θ 0 π 6 π 3 π 2 2 π 3 5 π 6 π 7 π 6 4 π 3 3 π 2 5 π 3 11 π 6 2 π
r 7 6.3 4.5 2 −0.5 −2.3 −3 −2.3 −0.5 2 4.5 6.3 7

As expected, the values begin to repeat after θ = π . The graph is shown in [link] .

Graph of inner loop limaçon r=2+5cos(theta). Extends to the right. Points on edge plotted are (7,0), (4.5, pi/3), (2, pi/2), and (-3, pi).
Inner-loop limaçon
Got questions? Get instant answers now!

Investigating lemniscates

The lemniscate is a polar curve resembling the infinity symbol or a figure 8. Centered at the pole, a lemniscate is symmetrical by definition.

Formulas for lemniscates

The formulas that generate the graph of a lemniscate    are given by r 2 = a 2 cos 2 θ and r 2 = a 2 sin 2 θ where a 0. The formula r 2 = a 2 sin 2 θ is symmetric with respect to the pole. The formula r 2 = a 2 cos 2 θ is symmetric with respect to the pole, the line θ = π 2 , and the polar axis. See [link] for the graphs.

Four graphs of lemniscates side by side. (A) is r^2 = a^2 * cos(2theta). Horizonatal figure eight, on x-axis. (B) is r^2 = - a^2 * cos(2theta). Vertical figure eight, on y axis. (C) is r^2 = a^2 * sin(2theta). Diagonal figure eight on line y=x. (D) is r^2 = -a^2 *sin(2theta). Diagonal figure eight on line y=-x.

Sketching the graph of a lemniscate

Sketch the graph of r 2 = 4 cos 2 θ .

The equation exhibits symmetry with respect to the line θ = π 2 , the polar axis, and the pole.

Let’s find the zeros. It should be routine by now, but we will approach this equation a little differently by making the substitution u = 2 θ .

0 = 4 cos 2 θ 0 = 4 cos u 0 = cos u cos 1 0 = π 2 u = π 2 Substitute  2 θ  back in for  u . 2 θ = π 2 θ = π 4

So, the point ( 0 , π 4 ) is a zero of the equation.

Now let’s find the maximum value. Since the maximum of cos u = 1 when u = 0 , the maximum cos 2 θ = 1 when 2 θ = 0. Thus,

r 2 = 4 cos ( 0 ) r 2 = 4 ( 1 ) = 4 r = ± 4 = 2

We have a maximum at (2, 0). Since this graph is symmetric with respect to the pole, the line θ = π 2 , and the polar axis, we only need to plot points in the first quadrant.

Make a table similar to [link] .

θ 0 π 6 π 4 π 3 π 2
r 2 2 0 2 0

Plot the points on the graph, such as the one shown in [link] .
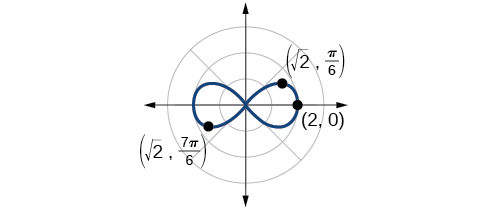
Graph of r^2 = 4cos(2theta). Horizontal lemniscate, along x-axis. Points on edge plotted are (2,0), (rad2, pi/6), (rad2 7pi/6).
Lemniscate
Got questions? Get instant answers now!

Investigating rose curves

The next type of polar equation produces a petal-like shape called a rose curve. Although the graphs look complex, a simple polar equation generates the pattern.

Rose curves

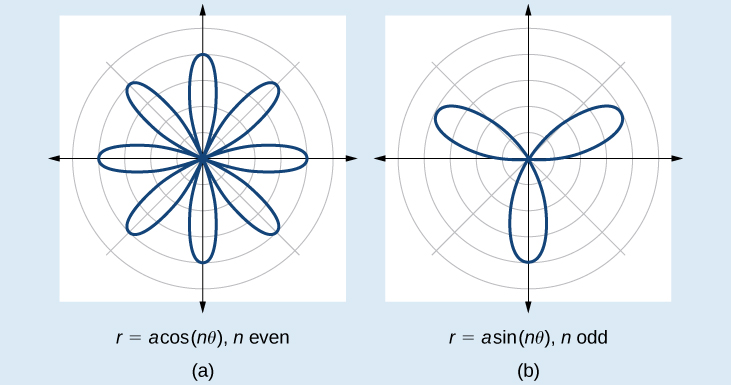
The formulas that generate the graph of a rose curve    are given by r = a cos n θ and r = a sin n θ where a 0. If n is even, the curve has 2 n petals. If n is odd, the curve has n petals. See [link] .

Graph of two rose curves side by side. (A) is r=acos(ntheta), where n is even. Eight petals extending from origin, equally spaced. (B) is r=asin(ntheta) where n is odd. Three petals extending from the origin, equally spaced.

Questions & Answers

what is biology
Hajah Reply
the study of living organisms and their interactions with one another and their environments
AI-Robot
what is biology
Victoria Reply
HOW CAN MAN ORGAN FUNCTION
Alfred Reply
the diagram of the digestive system
Assiatu Reply
allimentary cannel
Ogenrwot
How does twins formed
William Reply
They formed in two ways first when one sperm and one egg are splited by mitosis or two sperm and two eggs join together
Oluwatobi
what is genetics
Josephine Reply
Genetics is the study of heredity
Misack
how does twins formed?
Misack
What is manual
Hassan Reply
discuss biological phenomenon and provide pieces of evidence to show that it was responsible for the formation of eukaryotic organelles
Joseph Reply
what is biology
Yousuf Reply
the study of living organisms and their interactions with one another and their environment.
Wine
discuss the biological phenomenon and provide pieces of evidence to show that it was responsible for the formation of eukaryotic organelles in an essay form
Joseph Reply
what is the blood cells
Shaker Reply
list any five characteristics of the blood cells
Shaker
lack electricity and its more savely than electronic microscope because its naturally by using of light
Abdullahi Reply
advantage of electronic microscope is easily and clearly while disadvantage is dangerous because its electronic. advantage of light microscope is savely and naturally by sun while disadvantage is not easily,means its not sharp and not clear
Abdullahi
cell theory state that every organisms composed of one or more cell,cell is the basic unit of life
Abdullahi
is like gone fail us
DENG
cells is the basic structure and functions of all living things
Ramadan
What is classification
ISCONT Reply
is organisms that are similar into groups called tara
Yamosa
in what situation (s) would be the use of a scanning electron microscope be ideal and why?
Kenna Reply
A scanning electron microscope (SEM) is ideal for situations requiring high-resolution imaging of surfaces. It is commonly used in materials science, biology, and geology to examine the topography and composition of samples at a nanoscale level. SEM is particularly useful for studying fine details,
Hilary
cell is the building block of life.
Condoleezza Reply
Got questions? Join the online conversation and get instant answers!
Jobilize.com Reply
Practice Key Terms 9

Get Jobilize Job Search Mobile App in your pocket Now!

Get it on Google Play Download on the App Store Now


Source:  OpenStax, Precalculus. OpenStax CNX. Jan 19, 2016 Download for free at https://legacy.cnx.org/content/col11667/1.6
Google Play and the Google Play logo are trademarks of Google Inc.

Notification Switch

Would you like to follow the 'Precalculus' conversation and receive update notifications?

Ask