Because
r is significant and the scatter plot shows a linear trend, the regression line can be used to predict final exam scores.
Method 2: using a table of critical values to make a decision
The
95% Critical Values of the Sample Correlation Coefficient Table can be used to give you a good idea of whether the computed value of
is significant or not . Compare
r to the appropriate critical value in the table. If
r is not between the positive and negative critical values, then the correlation coefficient is significant. If
r is significant, then you may want to use the line for prediction.
Suppose you computed
r = 0.801 using
n = 10 data points.
df =
n - 2 = 10 - 2 = 8. The critical values associated with
df = 8 are -0.632 and + 0.632. If
r <negative critical value or
r >positive critical value, then
r issignificant. Since
r = 0.801 and 0.801>0.632,
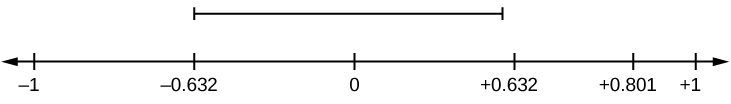
r is significant and the line may be usedfor prediction. If you view this example on a number line, it will help you.
r is not significant between -0.632 and +0.632.
r = 0.801>+0.632. Therefore,
r is significant.
For a given line of best fit, you computed that
r = 0.6501 using
n = 12 data points and the critical value is 0.576. Can the line be used for prediction? Why or why not?
If the scatter plot looks linear then, yes, the line can be used for prediction, because
r >the positive critical value.
Suppose you computed
r = –0.624 with 14 data points.
df = 14 – 2 = 12. The critical values are –0.532 and 0.532. Since –0.624<–0.532,
r is significant and the line can be used for prediction
For a given line of best fit, you compute that
r = 0.5204 using
n = 9 data points, and the critical value is 0.666. Can the line be used for prediction? Why or why not?
No, the line cannot be used for prediction, because
r <the positive critical value.
Suppose you computed
r = 0.776 and
n = 6.
df = 6 – 2 = 4. The critical values are –0.811 and 0.811. Since –0.811<0.776<0.811,
r is not significant, and the line should not be used for prediction.
-0.811<
r = 0.776<0.811. Therefore,
r is not significant.
For a given line of best fit, you compute that
r = –0.7204 using
n = 8 data points, and the critical value is = 0.707. Can the line be used for prediction? Why or why not?
Yes, the line can be used for prediction, because r<the negative critical value.
Third-exam vs final-exam example: critical value method
Consider the
third exam/final exam example .
The line of best fit is:
ŷ = –173.51+4.83
x with
r = 0.6631 and there are
n = 11 data points. Can the regression line be used for prediction?
Given a third-exam score (
x value), can we use the line to predict the final exam score (predicted
y value)?
H
0 :
ρ = 0
H
a :
ρ ≠ 0
α = 0.05
Use the "95% Critical Value" table for
r with
df =
n – 2 = 11 – 2 = 9.
The critical values are –0.602 and +0.602
Since 0.6631>0.602,
r is significant.
Decision: Reject the null hypothesis.
Conclusion:There is sufficient evidence to conclude that there is a significant linear relationship between the third exam score (
x ) and the final exam score (
y ) because the correlation coefficient is significantly different from zero.
Questions & Answers
Discuss the differences between taste and flavor, including how other sensory inputs contribute to our perception of flavor.
The lymphatic system plays several crucial roles in the human body, functioning as a key component of the immune system and contributing to the maintenance of fluid balance. Its main functions include:
1. Immune Response: The lymphatic system produces and transports lymphocytes, which are a type of
asegid
to transport fluids fats proteins and lymphocytes to the blood stream as lymph
Anatomy is the study of the structure of the body, while physiology is the study of the function of the body. Anatomy looks at the body's organs and systems, while physiology looks at how those organs and systems work together to keep the body functioning.
Enzymes are proteins that help speed up chemical reactions in our bodies. Enzymes are essential for digestion, liver function and much more. Too much or too little of a certain enzyme can cause health problems
Kamara
yes
Prince
how does the stomach protect itself from the damaging effects of HCl
the normal temperature is 37°c or 98.6 °Fahrenheit is important for maintaining the homeostasis in the body
the body regular this temperature through the process called thermoregulation which involves brain skin muscle and other organ working together to maintain stable internal temperature