Because
r is significant and the scatter plot shows a linear trend, the regression line can be used to predict final exam scores.
Method 2: using a table of critical values to make a decision
The
95% Critical Values of the Sample Correlation Coefficient Table can be used to give you a good idea of whether the computed value of
is significant or not . Compare
r to the appropriate critical value in the table. If
r is not between the positive and negative critical values, then the correlation coefficient is significant. If
r is significant, then you may want to use the line for prediction.
Suppose you computed
r = 0.801 using
n = 10 data points.
df =
n - 2 = 10 - 2 = 8. The critical values associated with
df = 8 are -0.632 and + 0.632. If
r <negative critical value or
r >positive critical value, then
r issignificant. Since
r = 0.801 and 0.801>0.632,
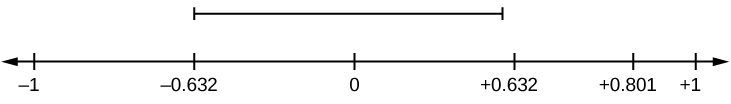
r is significant and the line may be usedfor prediction. If you view this example on a number line, it will help you.
r is not significant between -0.632 and +0.632.
r = 0.801>+0.632. Therefore,
r is significant.
For a given line of best fit, you computed that
r = 0.6501 using
n = 12 data points and the critical value is 0.576. Can the line be used for prediction? Why or why not?
If the scatter plot looks linear then, yes, the line can be used for prediction, because
r >the positive critical value.
Suppose you computed
r = –0.624 with 14 data points.
df = 14 – 2 = 12. The critical values are –0.532 and 0.532. Since –0.624<–0.532,
r is significant and the line can be used for prediction
For a given line of best fit, you compute that
r = 0.5204 using
n = 9 data points, and the critical value is 0.666. Can the line be used for prediction? Why or why not?
No, the line cannot be used for prediction, because
r <the positive critical value.
Suppose you computed
r = 0.776 and
n = 6.
df = 6 – 2 = 4. The critical values are –0.811 and 0.811. Since –0.811<0.776<0.811,
r is not significant, and the line should not be used for prediction.
-0.811<
r = 0.776<0.811. Therefore,
r is not significant.
For a given line of best fit, you compute that
r = –0.7204 using
n = 8 data points, and the critical value is = 0.707. Can the line be used for prediction? Why or why not?
Yes, the line can be used for prediction, because r<the negative critical value.
Third-exam vs final-exam example: critical value method
Consider the
third exam/final exam example .
The line of best fit is:
ŷ = –173.51+4.83
x with
r = 0.6631 and there are
n = 11 data points. Can the regression line be used for prediction?
Given a third-exam score (
x value), can we use the line to predict the final exam score (predicted
y value)?
H
0 :
ρ = 0
H
a :
ρ ≠ 0
α = 0.05
Use the "95% Critical Value" table for
r with
df =
n – 2 = 11 – 2 = 9.
The critical values are –0.602 and +0.602
Since 0.6631>0.602,
r is significant.
Decision: Reject the null hypothesis.
Conclusion:There is sufficient evidence to conclude that there is a significant linear relationship between the third exam score (
x ) and the final exam score (
y ) because the correlation coefficient is significantly different from zero.
Questions & Answers
Biology is a branch of Natural science which deals/About living Organism.
the study of living organisms and their interactions with one another and their environment.
Wine
discuss the biological phenomenon and provide pieces of evidence to show that it was responsible for the formation of eukaryotic organelles in an essay form
advantage of electronic microscope is easily and clearly while disadvantage is dangerous because its electronic. advantage of light microscope is savely and naturally by sun while disadvantage is not easily,means its not sharp and not clear
Abdullahi
cell theory state that every organisms composed of one or more cell,cell is the basic unit of life
Abdullahi
is like gone fail us
DENG
cells is the basic structure and functions of all living things