INTERPRETATION OF THE SLOPE: The slope of the best-fit line tells us how the dependent variable (
y ) changes for every one unit increase in the independent (
x ) variable, on average.
Third exam vs final exam example
Slope: The slope of the line is
b = 4.83.
Interpretation: For a one-point increase in the score on the third exam, the final exam score increases by 4.83 points, on average.
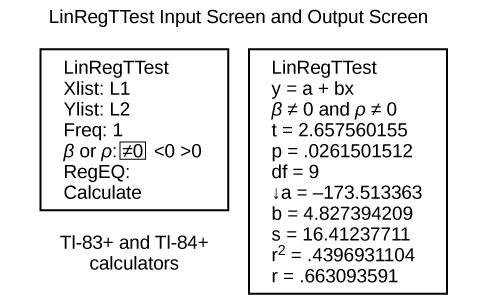
Using the Linear Regression T Test: LinRegTTest
In the STAT list editor, enter the X data in list L1 and the Y data in list L2, paired so that the corresponding (
x ,
y ) values are next to each other in the lists. (If a particular pair of values is repeated, enter it as many times as it appears in the data.)
On the STAT TESTS menu, scroll down with the cursor to select the LinRegTTest. (Be careful to select LinRegTTest, as some calculators may also have a different item called LinRegTInt.)
On the LinRegTTest input screen enter: Xlist: L1 ; Ylist: L2 ; Freq: 1
On the next line, at the prompt
β or
ρ , highlight "≠ 0" and press ENTER
Leave the line for "RegEq:" blank
Highlight Calculate and press ENTER.
The output screen contains a lot of information. For now we will focus on a few items from the output, and will return later to the other items.
The second line says
y =
a +
bx . Scroll down to find the values
a = –173.513, and
b = 4.8273; the equation of the best fit line is
ŷ = –173.51 + 4.83
x The two items at the bottom are
r2 = 0.43969 and
r = 0.663. For now, just note where to find these values; we will discuss them in the next two sections.
Graphing the Scatterplot and Regression Line
We are assuming your X data is already entered in list L1 and your Y data is in list L2
Press 2nd STATPLOT ENTER to use Plot 1
On the input screen for PLOT 1, highlight
On , and press ENTER
For TYPE: highlight the very first icon which is the scatterplot and press ENTER
Indicate Xlist: L1 and Ylist: L2
For Mark: it does not matter which symbol you highlight.
Press the ZOOM key and then the number 9 (for menu item "ZoomStat") ; the calculator will fit the window to the data
To graph the best-fit line, press the "Y=" key and type the equation –173.5 + 4.83X into equation Y1. (The X key is immediately left of the STAT key). Press ZOOM 9 again to graph it.
Optional: If you want to change the viewing window, press the WINDOW key. Enter your desired window using Xmin, Xmax, Ymin, Ymax
Note
Another way to graph the line after you create a scatter plot is to use LinRegTTest.
Make sure you have done the scatter plot. Check it on your screen.
Go to LinRegTTest and enter the lists.
At RegEq: press VARS and arrow over to Y-VARS. Press 1 for 1:Function. Press 1 for 1:Y1. Then arrow down to Calculate and do the calculation for the line of best fit.
Press Y = (you will see the regression equation).
Press GRAPH. The line will be drawn."
The correlation coefficient
r
Besides looking at the scatter plot and seeing that a line seems reasonable, how can you tell if the line is a good predictor? Use the correlation coefficient as another indicator (besides the scatterplot) of the strength of the relationship between
x and
y .
Wayne and Dennis like to ride the bike path from Riverside Park to the beach. Dennis’s speed is seven miles per hour faster than Wayne’s speed, so it takes Wayne 2 hours to ride to the beach while it takes Dennis 1.5 hours for the ride. Find the speed of both bikers.
from theory: distance [miles] = speed [mph] × time [hours]
info #1
speed_Dennis × 1.5 = speed_Wayne × 2
=> speed_Wayne = 0.75 × speed_Dennis (i)
info #2
speed_Dennis = speed_Wayne + 7 [mph] (ii)
use (i) in (ii) => [...]
speed_Dennis = 28 mph
speed_Wayne = 21 mph
George
Let W be Wayne's speed in miles per hour and D be Dennis's speed in miles per hour. We know that W + 7 = D and W * 2 = D * 1.5.
Substituting the first equation into the second:
W * 2 = (W + 7) * 1.5
W * 2 = W * 1.5 + 7 * 1.5
0.5 * W = 7 * 1.5
W = 7 * 3 or 21
W is 21
D = W + 7
D = 21 + 7
D = 28
Salma
Devon is 32 32 years older than his son, Milan. The sum of both their ages is 54 54. Using the variables d d and m m to represent the ages of Devon and Milan, respectively, write a system of equations to describe this situation. Enter the equations below, separated by a comma.
please why is it that the 0is in the place of ten thousand
Grace
Send the example to me here and let me see
Stephen
A meditation garden is in the shape of a right triangle, with one leg 7 feet. The length of the hypotenuse is one more than the length of one of the other legs. Find the lengths of the hypotenuse and the other leg
however, may I ask you some questions about Algarba?
Amoon
hi
Enock
what the last part of the problem mean?
Roger
The Jones family took a 15 mile canoe ride down the Indian River in three hours. After lunch, the return trip back up the river took five hours. Find the rate, in mph, of the canoe in still water and the rate of the current.
Shakir works at a computer store. His weekly pay will be either a fixed amount, $925, or $500 plus 12% of his total sales. How much should his total sales be for his variable pay option to exceed the fixed amount of $925.
I'm guessing, but it's somewhere around $4335.00 I think
Lewis
12% of sales will need to exceed 925 - 500, or 425 to exceed fixed amount option. What amount of sales does that equal? 425 ÷ (12÷100) = 3541.67. So the answer is sales greater than 3541.67.
Check:
Sales = 3542
Commission 12%=425.04
Pay = 500 + 425.04 = 925.04.
925.04 > 925.00
Munster
difference between rational and irrational numbers
Jazmine trained for 3 hours on Saturday. She ran 8 miles and then biked 24 miles. Her biking speed is 4 mph faster than her running speed. What is her running speed?