Calculate Cohen’s
d for
[link] . Is the size of the effect small, medium or large? Explain what the size of the effect means for this problem.
d = 0.834; Large, because 0.834 is greater than Cohen’s 0.8 for a large effect size. The size of the differences between the means of the Final Exam scores of online students and students in a face-to-face class is large indicating a significant difference.
Weighted alpha is a measure of risk-adjusted performance of stocks over a period of a year. A high positive weighted alpha signifies a stock whose price has risen while a small positive weighted alpha indicates an unchanged stock price during the time period. Weighted alpha is used to identify companies with strong upward or downward trends. The weighted alpha for the top 30 stocks of banks in the northeast and in the west as identified by Nasdaq on May 24, 2013 are listed in
[link] and
[link] , respectively.
Northeast
94.2
75.2
69.6
52.0
48.0
41.9
36.4
33.4
31.5
27.6
77.3
71.9
67.5
50.6
46.2
38.4
35.2
33.0
28.7
26.5
76.3
71.7
56.3
48.7
43.2
37.6
33.7
31.8
28.5
26.0
West
126.0
70.6
65.2
51.4
45.5
37.0
33.0
29.6
23.7
22.6
116.1
70.6
58.2
51.2
43.2
36.0
31.4
28.7
23.5
21.6
78.2
68.2
55.6
50.3
39.0
34.1
31.0
25.3
23.4
21.5
Is there a difference in the weighted alpha of the top 30 stocks of banks in the northeast and in the west? Test at a 5% significance level. Answer the following questions:
Is this a test of two means or two proportions?
Are the population standard deviations known or unknown?
Which distribution do you use to perform the test?
What is the random variable?
What are the null and alternative hypotheses? Write the null and alternative hypotheses in words and in symbols.
Is this test right, left, or two tailed?
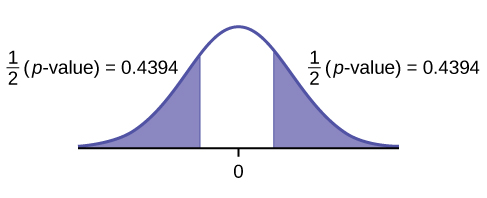
What is the
p -value?
Do you reject or not reject the null hypothesis?
At the ___ level of significance, from the sample data, there ______ (is/is not) sufficient evidence to conclude that ______.
Calculate Cohen’s
d and interpret it.
two means
unknown
Student’s-t
H0 :
μ1 =
μ2 Null hypothesis: the means of the weighted alphas are equal.
Ha :
μ1 ≠
μ2 Alternative hypothesis : the means of the weighted alphas are not equal.
two-tailed
p -value = 0.8787
Do not reject the null hypothesis
This indicates that the trends in stocks are about the same in the top 30 banks in each region.
5% level of significance, from the sample data, there
is not sufficient evidence to conclude that
the mean weighted alphas for the banks in the northeast and the west are different
d = 0.040, Very small, because 0.040 is less than Cohen’s value of 0.2 for small effect size. The size of the difference of the means of the weighted alphas for the two regions of banks is small indicating that there is not a significant difference between their trends in stocks.
Data from Graduating Engineer + Computer Careers. Available online at http://www.graduatingengineer.com
Data from
Microsoft Bookshelf .
Data from the United States Senate website, available online at www.Senate.gov (accessed June 17, 2013).
“List of current United States Senators by Age.” Wikipedia. Available online at http://en.wikipedia.org/wiki/List_of_current_United_States_Senators_by_age (accessed June 17, 2013).
Step 1: Find the mean. To find the mean, add up all the scores, then divide them by the number of scores. ...
Step 2: Find each score's deviation from the mean. ...
Step 3: Square each deviation from the mean. ...
Step 4: Find the sum of squares. ...
Step 5: Divide the sum of squares by n – 1 or N.
The sample of 16 students is taken. The average age in the sample was 22 years with astandard deviation of 6 years. Construct a 95% confidence interval for the age of the population.
Bhartdarshan' is an internet-based travel agency wherein customer can see videos of the cities they plant to visit. The number of hits daily is a normally distributed random variable with a mean of 10,000 and a standard deviation of 2,400
a. what is the probability of getting more than 12,000 hits?
b. what is the probability of getting fewer than 9,000 hits?
Bhartdarshan'is an internet-based travel agency wherein customer can see videos of the cities they plan to visit. The number of hits daily is a normally distributed random variable with a mean of 10,000 and a standard deviation of 2,400.
a. What is the probability of getting more than 12,000 hits