Calculate Cohen’s
d for
[link] . Is the size of the effect small, medium or large? Explain what the size of the effect means for this problem.
d = 0.834; Large, because 0.834 is greater than Cohen’s 0.8 for a large effect size. The size of the differences between the means of the Final Exam scores of online students and students in a face-to-face class is large indicating a significant difference.
Weighted alpha is a measure of risk-adjusted performance of stocks over a period of a year. A high positive weighted alpha signifies a stock whose price has risen while a small positive weighted alpha indicates an unchanged stock price during the time period. Weighted alpha is used to identify companies with strong upward or downward trends. The weighted alpha for the top 30 stocks of banks in the northeast and in the west as identified by Nasdaq on May 24, 2013 are listed in
[link] and
[link] , respectively.
Northeast
94.2
75.2
69.6
52.0
48.0
41.9
36.4
33.4
31.5
27.6
77.3
71.9
67.5
50.6
46.2
38.4
35.2
33.0
28.7
26.5
76.3
71.7
56.3
48.7
43.2
37.6
33.7
31.8
28.5
26.0
West
126.0
70.6
65.2
51.4
45.5
37.0
33.0
29.6
23.7
22.6
116.1
70.6
58.2
51.2
43.2
36.0
31.4
28.7
23.5
21.6
78.2
68.2
55.6
50.3
39.0
34.1
31.0
25.3
23.4
21.5
Is there a difference in the weighted alpha of the top 30 stocks of banks in the northeast and in the west? Test at a 5% significance level. Answer the following questions:
Is this a test of two means or two proportions?
Are the population standard deviations known or unknown?
Which distribution do you use to perform the test?
What is the random variable?
What are the null and alternative hypotheses? Write the null and alternative hypotheses in words and in symbols.
Is this test right, left, or two tailed?
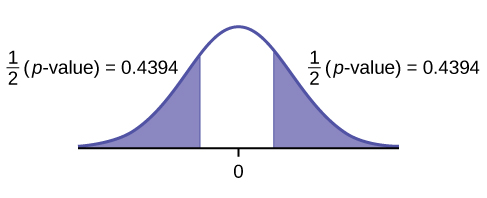
What is the
p -value?
Do you reject or not reject the null hypothesis?
At the ___ level of significance, from the sample data, there ______ (is/is not) sufficient evidence to conclude that ______.
Calculate Cohen’s
d and interpret it.
two means
unknown
Student’s-t
H0 :
μ1 =
μ2 Null hypothesis: the means of the weighted alphas are equal.
Ha :
μ1 ≠
μ2 Alternative hypothesis : the means of the weighted alphas are not equal.
two-tailed
p -value = 0.8787
Do not reject the null hypothesis
This indicates that the trends in stocks are about the same in the top 30 banks in each region.
5% level of significance, from the sample data, there
is not sufficient evidence to conclude that
the mean weighted alphas for the banks in the northeast and the west are different
d = 0.040, Very small, because 0.040 is less than Cohen’s value of 0.2 for small effect size. The size of the difference of the means of the weighted alphas for the two regions of banks is small indicating that there is not a significant difference between their trends in stocks.
Data from Graduating Engineer + Computer Careers. Available online at http://www.graduatingengineer.com
Data from
Microsoft Bookshelf .
Data from the United States Senate website, available online at www.Senate.gov (accessed June 17, 2013).
“List of current United States Senators by Age.” Wikipedia. Available online at http://en.wikipedia.org/wiki/List_of_current_United_States_Senators_by_age (accessed June 17, 2013).
Questions & Answers
What are the factors that affect demand for a commodity
In economics, a perfect market refers to a theoretical construct where all participants have perfect information, goods are homogenous, there are no barriers to entry or exit, and prices are determined solely by supply and demand. It's an idealized model used for analysis,
When MP₁ becomes negative, TP start to decline.
Extuples Suppose that the short-run production function of certain cut-flower firm is given by: Q=4KL-0.6K2 - 0.112 •
Where is quantity of cut flower produced, I is labour input and K is fixed capital input (K-5). Determine the average product of lab
Kelo
Extuples Suppose that the short-run production function of certain cut-flower firm is given by: Q=4KL-0.6K2 - 0.112 •
Where is quantity of cut flower produced, I is labour input and K is fixed capital input (K-5). Determine the average product of labour (APL) and marginal product of labour (MPL)
Quantity demanded refers to the specific amount of a good or service that consumers are willing and able to purchase at a give price and within a specific time period. Demand, on the other hand, is a broader concept that encompasses the entire relationship between price and quantity demanded
Ezea
ok
Shukri
how do you save a country economic situation when it's falling apart
Economic growth as an increase in the production and consumption of goods and services within an economy.but
Economic development as a broader concept that encompasses not only economic growth but also social & human well being.
Shukri
production function means
Jabir
What do you think is more important to focus on when considering inequality ?
sir...I just want to ask one question... Define the term contract curve? if you are free please help me to find this answer 🙏
Asui
it is a curve that we get after connecting the pareto optimal combinations of two consumers after their mutually beneficial trade offs
Awais
thank you so much 👍 sir
Asui
In economics, the contract curve refers to the set of points in an Edgeworth box diagram where both parties involved in a trade cannot be made better off without making one of them worse off. It represents the Pareto efficient allocations of goods between two individuals or entities, where neither p
Cornelius
In economics, the contract curve refers to the set of points in an Edgeworth box diagram where both parties involved in a trade cannot be made better off without making one of them worse off. It represents the Pareto efficient allocations of goods between two individuals or entities,
Cornelius
Suppose a consumer consuming two commodities X and Y has
The following utility function u=X0.4 Y0.6. If the price of the X and Y are 2 and 3 respectively and income Constraint is birr 50.
A,Calculate quantities of x and y which maximize utility.
B,Calculate value of Lagrange multiplier.
C,Calculate quantities of X and Y consumed with a given price.
D,alculate optimum level of output .
the market for lemon has 10 potential consumers, each having an individual demand curve p=101-10Qi, where p is price in dollar's per cup and Qi is the number of cups demanded per week by the i th consumer.Find the market demand curve using algebra. Draw an individual demand curve and the market dema
suppose the production function is given by ( L, K)=L¼K¾.assuming capital is fixed find APL and MPL. consider the following short run production function:Q=6L²-0.4L³ a) find the value of L that maximizes output b)find the value of L that maximizes marginal product
Abdureman
Got questions? Join the online conversation and get instant answers!