| << Chapter < Page | Chapter >> Page > |
Data from the United States Census Bureau. Available online at http://www.census.gov/prod/cen2010/briefs/c2010br-02.pdf
Hinduja, Sameer. “Sexting Research and Gender Differences.” Cyberbulling Research Center, 2013. Available online at http://cyberbullying.us/blog/sexting-research-and-gender-differences/ (accessed June 17, 2013).
“Smart Phone Users, By the Numbers.” Visually, 2013. Available online at http://visual.ly/smart-phone-users-numbers (accessed June 17, 2013).
Smith, Aaron. “35% of American adults own a Smartphone.” Pew Internet, 2013. Available online at http://www.pewinternet.org/~/media/Files/Reports/2011/PIP_Smartphones.pdf (accessed June 17, 2013).
“State-Specific Prevalence of Obesity AmongAduls—Unites States, 2007.” MMWR, CDC. Available online at http://www.cdc.gov/mmwr/preview/mmwrhtml/mm5728a1.htm (accessed June 17, 2013).
“Texas Crime Rates 1960–1012.” FBI, Uniform Crime Reports, 2013. Available online at: http://www.disastercenter.com/crime/txcrime.htm (accessed June 17, 2013).
A hypothesis test of two population means from independent samples where the population standard deviations are known (typically approximated with the sample standard deviations), will have these characteristics:
Normal Distribution:
.
Generally
µ
1 –
µ
2 = 0.
Test Statistic (
z -score):
Generally
µ
1 -
µ
2 = 0.
where:
σ
1 and
σ
2 are the known population standard deviations.
n
1 and
n
2 are the sample sizes.
and
are the sample means.
μ
1 and
μ
2 are the population means.
Use the following information to answer the next five exercises. The mean speeds of fastball pitches from two different baseball pitchers are to be compared. A sample of 14 fastball pitches is measured from each pitcher. The populations have normal distributions. [link] shows the result. Scouters believe that Rodriguez pitches a speedier fastball.
| Pitcher | Sample Mean Speed of Pitches (mph) | Population Standard Deviation |
|---|---|---|
| Wesley | 86 | 3 |
| Rodriguez | 91 | 7 |
What is the random variable?
The difference in mean speeds of the fastball pitches of the two pitchers
State the null and alternative hypotheses.
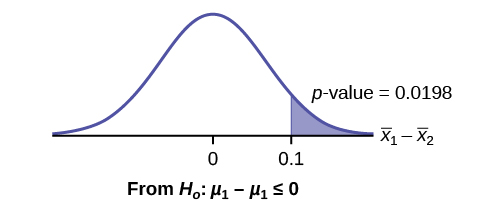
What is the p -value?
At the 1% significance level, what is your conclusion?
At the 1% significance level, we can reject the null hypothesis. There is sufficient data to conclude that the mean speed of Rodriguez’s fastball is faster than Wesley’s.
Use the following information to answer the next five exercises. A researcher is testing the effects of plant food on plant growth. Nine plants have been given the plant food. Another nine plants have not been given the plant food. The heights of the plants are recorded after eight weeks. The populations have normal distributions. The following table is the result. The researcher thinks the food makes the plants grow taller.
| Plant Group | Sample Mean Height of Plants (inches) | Population Standard Deviation |
|---|---|---|
| Food | 16 | 2.5 |
| No food | 14 | 1.5 |
Is the population standard deviation known or unknown?
State the null and alternative hypotheses.
Subscripts: 1 = Food, 2 = No Food
H
0 :
μ
1 ≤
μ
2
H
a :
μ
1 >
μ
2
What is the p -value?
At the 1% significance level, what is your conclusion?
Use the following information to answer the next five exercises. Two metal alloys are being considered as material for ball bearings. The mean melting point of the two alloys is to be compared. 15 pieces of each metal are being tested. Both populations have normal distributions. The following table is the result. It is believed that Alloy Zeta has a different melting point.
| Sample Mean Melting Temperatures (°F) | Population Standard Deviation | |
|---|---|---|
| Alloy Gamma | 800 | 95 |
| Alloy Zeta | 900 | 105 |
State the null and alternative hypotheses.
Subscripts: 1 = Gamma, 2 = Zeta
H
0 :
μ
1 =
μ
2
H
a :
μ
1 ≠
μ
2
Is this a right-, left-, or two-tailed test?
Draw the graph of the p -value.
At the 1% significance level, what is your conclusion?
There is sufficient evidence to reject the null hypothesis. The data support that the melting point for Alloy Zeta is different from the melting point of Alloy Gamma.
Notification Switch
Would you like to follow the 'Introductory statistics' conversation and receive update notifications?

|
|

|
|

|
|

|
|

|
|

|
|

|
|

|
|

|
|

|
|

|