| << Chapter < Page | Chapter >> Page > |
Suppose the time it takes a student to finish a quiz is uniformly distributed between six and 15 minutes, inclusive. Let X = the time, in minutes, it takes a student to finish a quiz. Then X ~ U (6, 15).
Find the probability that a randomly selected student needs at least eight minutes to complete the quiz. Then find the probability that a different student needs at least eight minutes to finish the quiz given that she has already taken more than seven minutes.
P ( x >8) = 0.7778
P ( x >8 | x>7) = 0.875
Ace Heating and Air Conditioning Service finds that the amount of time a repairman needs to fix a furnace is uniformly distributed between 1.5 and four hours. Let x = the time needed to fix a furnace. Then x ~ U (1.5, 4).
e.
and
hours and
hours
The amount of time a service technician needs to change the oil in a car is uniformly distributed between 11 and 21 minutes. Let X = the time needed to change the oil on a car.
If X has a uniform distribution where a < x < b or a ≤ x ≤ b , then X takes on values between a and b (may include a and b ). All values x are equally likely. We write X ∼ U ( a , b ). The mean of X is . The standard deviation of X is . The probability density function of X is for a ≤ x ≤ b . The cumulative distribution function of X is P ( X ≤ x ) = . X is continuous.
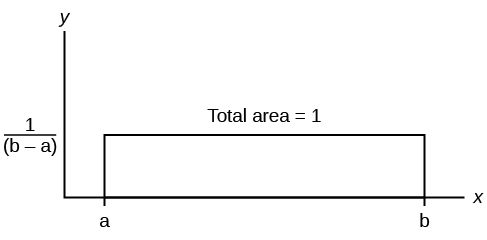
The probability P ( c < X < d ) may be found by computing the area under f ( x ), between c and d . Since the corresponding area is a rectangle, the area may be found simply by multiplying the width and the height.
X = a real number between a and b (in some instances, X can take on the values a and b ). a = smallest X ; b = largest X
X ~ U (a, b)
The mean is
The standard deviation is
Probability density function: for
Area to the Left of x : P ( X < x ) = ( x – a )
Area to the Right of x : P ( X > x ) = ( b – x )
Area Between c and d : P ( c < x < d ) = (base)(height) = ( d – c )
Uniform: X ~ U ( a , b ) where a < x < b
McDougall, John A. The McDougall Program for Maximum Weight Loss. Plume, 1995.
Use the following information to answer the next ten questions. The data that follow are the square footage (in 1,000 feet squared) of 28 homes.
| 1.5 | 2.4 | 3.6 | 2.6 | 1.6 | 2.4 | 2.0 |
| 3.5 | 2.5 | 1.8 | 2.4 | 2.5 | 3.5 | 4.0 |
| 2.6 | 1.6 | 2.2 | 1.8 | 3.8 | 2.5 | 1.5 |
| 2.8 | 1.8 | 4.5 | 1.9 | 1.9 | 3.1 | 1.6 |
The sample mean = 2.50 and the sample standard deviation = 0.8302.
The distribution can be written as X ~ U (1.5, 4.5).
What type of distribution is this?
In this distribution, outcomes are equally likely. What does this mean?
It means that the value of x is just as likely to be any number between 1.5 and 4.5.
What is the height of f ( x ) for the continuous probability distribution?
What are the constraints for the values of x ?
1.5 ≤ x ≤ 4.5
Graph P (2< x <3).
What is P (x<3.5| x <4)?
What is the 90 th percentile of square footage for homes?
Find the probability that a randomly selected home has more than 3,000 square feet given that you already know the house has more than 2,000 square feet.
0.6
Use the following information to answer the next eight exercises. A distribution is given as
X ~
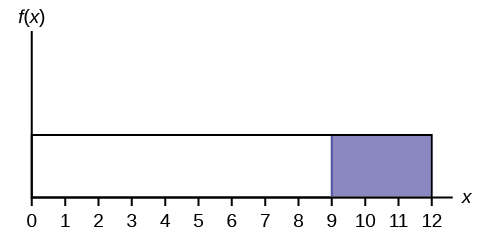
U (0, 12).
What is a ? What does it represent?
What is b ? What does it represent?
b is 12, and it represents the highest value of x .
What is the probability density function?
What is the theoretical standard deviation?
Find P ( x >9).
Use the following information to answer the next eleven exercises. The age of cars in the staff parking lot of a suburban college is uniformly distributed from six months (0.5 years) to 9.5 years.
What is being measured here?
In words, define the random variable X .
X = The age (in years) of cars in the staff parking lot
Are the data discrete or continuous?
The distribution for X is ______.
Write the probability density function.
f ( x ) = where x is between 0.5 and 9.5, inclusive.
Graph the probability distribution.
Find the probability that a randomly chosen car in the lot was less than four years old.
Considering only the cars less than 7.5 years old, find the probability that a randomly chosen car in the lot was less than four years old.
What has changed in the previous two problems that made the solutions different?
Find the third quartile of ages of cars in the lot. This means you will have to find the value such that , or 75%, of the cars are at most (less than or equal to) that age.
Notification Switch
Would you like to follow the 'Introductory statistics' conversation and receive update notifications?

|
|

|
|

|
|

|
|

|
|

|
|

|
|

|
|

|
|
|
|
|
|