<< Chapter < Page Chapter >> Page >
Data
x y x y
1915 10.1 1969 36.7
1926 17.7 1975 49.3
1935 13.7 1979 72.6
1940 14.7 1980 82.4
1947 24.1 1986 109.6
1952 26.5 1991 130.7
1964 31.0 1999 166.6
  1. Draw a scatterplot of the data.
  2. Calculate the least squares line. Write the equation in the form ŷ = a + bx .
  3. Draw the line on the scatterplot.
  4. Find the correlation coefficient. Is it significant?
  5. What is the average CPI for the year 1990?
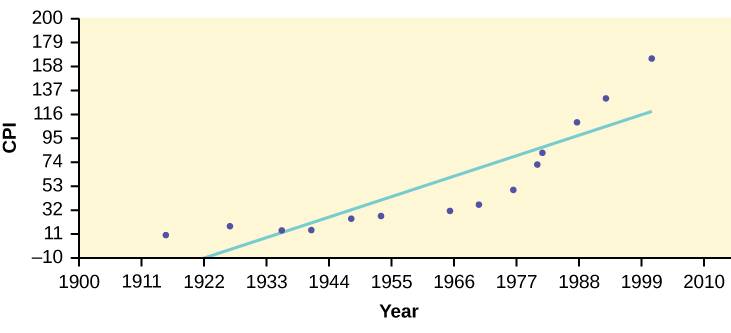
  1. See [link] .
  2. ŷ = –3204 + 1.662 x is the equation of the line of best fit.
  3. r = 0.8694
  4. The number of data points is n = 14. Use the 95% Critical Values of the Sample Correlation Coefficient table at the end of Chapter 12. n – 2 = 12. The corresponding critical value is 0.532. Since 0.8694>0.532, r is significant.
    ŷ = –3204 + 1.662(1990) = 103.4 CPI
  5. Using the calculator LinRegTTest, we find that s = 25.4 ; graphing the lines Y2 = –3204 + 1.662X – 2(25.4) and Y3 = –3204 + 1.662X + 2(25.4) shows that no data values are outside those lines, identifying no outliers. (Note that the year 1999 was very close to the upper line, but still inside it.)
Scatter plot and line of best fit of the consumer price index data, on the y-axis, and year data, on the x-axis.
Got questions? Get instant answers now!

Note

In the example, notice the pattern of the points compared to the line. Although the correlation coefficient is significant, the pattern in the scatterplot indicates that a curve would be a more appropriate model to use than a line. In this example, a statistician should prefer to use other methods to fit a curve to this data, rather than model the data with the line we found. In addition to doing the calculations, it is always important to look at the scatterplot when deciding whether a linear model is appropriate.

If you are interested in seeing more years of data, visit the Bureau of Labor Statistics CPI website ftp://ftp.bls.gov/pub/special.requests/cpi/cpiai.txt; our data is taken from the column entitled "Annual Avg." (third column from the right). For example you could add more current years of data. Try adding the more recent years: 2004: CPI = 188.9; 2008: CPI = 215.3; 2011: CPI = 224.9. See how it affects the model. (Check: ŷ = –4436 + 2.295 x ; r = 0.9018. Is r significant? Is the fit better with the addition of the new points?)

Try it

The following table shows economic development measured in per capita income PCINC.

Year PCINC Year PCINC
1870 340 1920 1050
1880 499 1930 1170
1890 592 1940 1364
1900 757 1950 1836
1910 927 1960 2132
  1. What are the independent and dependent variables?
  2. Draw a scatter plot.
  3. Use regression to find the line of best fit and the correlation coefficient.
  4. Interpret the significance of the correlation coefficient.
  5. Is there a linear relationship between the variables?
  6. Find the coefficient of determination and interpret it.
  7. What is the slope of the regression equation? What does it mean?
  8. Use the line of best fit to estimate PCINC for 1900, for 2000.
  9. Determine if there are any outliers.

a. The independent variable ( x ) is the year and the dependent variable ( y ) is the per capita income.

b.

c. ŷ = 18.61x – 34574; r = 0.9732

d. At df = 8, the critical value is 0.632. The r value is significant because it is greater than the critical value.

e. There does appear to be a linear relationship between the variables.

f. The coefficient of determination is 0.947, which means that 94.7% of the variation in PCINC is explained by the variation in the years.

g. and h. The slope of the regression equation is 18.61, and it means that per capita income increases by $18.61 for each passing year. ŷ = 785 when the year is 1900, and ŷ = 2,646 when the year is 2000.

i. There do not appear to be any outliers.

Got questions? Get instant answers now!

95% critical values of the sample correlation coefficient table

Degrees of Freedom: n – 2 Critical Values: (+ and –)
1 0.997
2 0.950
3 0.878
4 0.811
5 0.754
6 0.707
7 0.666
8 0.632
9 0.602
10 0.576
11 0.555
12 0.532
13 0.514
14 0.497
15 0.482
16 0.468
17 0.456
18 0.444
19 0.433
20 0.423
21 0.413
22 0.404
23 0.396
24 0.388
25 0.381
26 0.374
27 0.367
28 0.361
29 0.355
30 0.349
40 0.304
50 0.273
60 0.250
70 0.232
80 0.217
90 0.205
100 0.195

References

Data from the House Ways and Means Committee, the Health and Human Services Department.

Data from Microsoft Bookshelf.

Data from the United States Department of Labor, the Bureau of Labor Statistics.

Data from the Physician’s Handbook, 1990.

Data from the United States Department of Labor, the Bureau of Labor Statistics.

Chapter review

To determine if a point is an outlier, do one of the following:

  1. Input the following equations into the TI 83, 83+,84, 84+:

    y 1 = a + b x y 2 = ( 2 s ) a + b x y 3 = ( 2 s ) a + b x where s is the standard deviation of the residuals

    If any point is above y 2 or below y 3 then the point is considered to be an outlier.

  2. Use the residuals and compare their absolute values to 2 s where s is the standard deviation of the residuals. If the absolute value of any residual is greater than or equal to 2 s , then the corresponding point is an outlier.
  3. Note: The calculator function LinRegTTest (STATS TESTS LinRegTTest) calculates s .

Use the following information to answer the next four exercises. The scatter plot shows the relationship between hours spent studying and exam scores. The line shown is the calculated line of best fit. The correlation coefficient is 0.69.
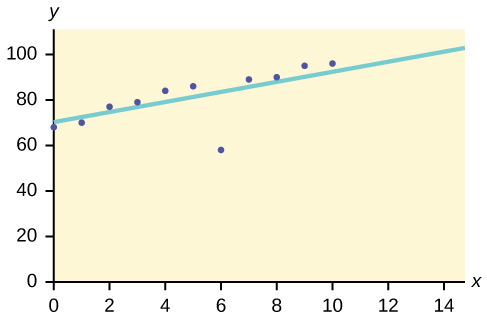
Do there appear to be any outliers?

Yes, there appears to be an outlier at (6, 58).

Got questions? Get instant answers now!

A point is removed, and the line of best fit is recalculated. The new correlation coefficient is 0.98. Does the point appear to have been an outlier? Why?

Got questions? Get instant answers now!

What effect did the potential outlier have on the line of best fit?

The potential outlier flattened the slope of the line of best fit because it was below the data set. It made the line of best fit less accurate is a predictor for the data.

Got questions? Get instant answers now!

Are you more or less confident in the predictive ability of the new line of best fit?

Got questions? Get instant answers now!

The Sum of Squared Errors for a data set of 18 numbers is 49. What is the standard deviation?

s = 1.75

Got questions? Get instant answers now!

The Standard Deviation for the Sum of Squared Errors for a data set is 9.8. What is the cutoff for the vertical distance that a point can be from the line of best fit to be considered an outlier?

Got questions? Get instant answers now!

Questions & Answers

What are the factors that affect demand for a commodity
Florence Reply
differentiate between demand and supply giving examples
Lambiv Reply
differentiated between demand and supply using examples
Lambiv
what is labour ?
Lambiv
how will I do?
Venny Reply
how is the graph works?I don't fully understand
Rezat Reply
information
Eliyee
devaluation
Eliyee
t
WARKISA
hi guys good evening to all
Lambiv
multiple choice question
Aster Reply
appreciation
Eliyee
explain perfect market
Lindiwe Reply
In economics, a perfect market refers to a theoretical construct where all participants have perfect information, goods are homogenous, there are no barriers to entry or exit, and prices are determined solely by supply and demand. It's an idealized model used for analysis,
Ezea
What is ceteris paribus?
Shukri Reply
other things being equal
AI-Robot
When MP₁ becomes negative, TP start to decline. Extuples Suppose that the short-run production function of certain cut-flower firm is given by: Q=4KL-0.6K2 - 0.112 • Where is quantity of cut flower produced, I is labour input and K is fixed capital input (K-5). Determine the average product of lab
Kelo
Extuples Suppose that the short-run production function of certain cut-flower firm is given by: Q=4KL-0.6K2 - 0.112 • Where is quantity of cut flower produced, I is labour input and K is fixed capital input (K-5). Determine the average product of labour (APL) and marginal product of labour (MPL)
Kelo
yes,thank you
Shukri
Can I ask you other question?
Shukri
what is monopoly mean?
Habtamu Reply
What is different between quantity demand and demand?
Shukri Reply
Quantity demanded refers to the specific amount of a good or service that consumers are willing and able to purchase at a give price and within a specific time period. Demand, on the other hand, is a broader concept that encompasses the entire relationship between price and quantity demanded
Ezea
ok
Shukri
how do you save a country economic situation when it's falling apart
Lilia Reply
what is the difference between economic growth and development
Fiker Reply
Economic growth as an increase in the production and consumption of goods and services within an economy.but Economic development as a broader concept that encompasses not only economic growth but also social & human well being.
Shukri
production function means
Jabir
What do you think is more important to focus on when considering inequality ?
Abdisa Reply
any question about economics?
Awais Reply
sir...I just want to ask one question... Define the term contract curve? if you are free please help me to find this answer 🙏
Asui
it is a curve that we get after connecting the pareto optimal combinations of two consumers after their mutually beneficial trade offs
Awais
thank you so much 👍 sir
Asui
In economics, the contract curve refers to the set of points in an Edgeworth box diagram where both parties involved in a trade cannot be made better off without making one of them worse off. It represents the Pareto efficient allocations of goods between two individuals or entities, where neither p
Cornelius
In economics, the contract curve refers to the set of points in an Edgeworth box diagram where both parties involved in a trade cannot be made better off without making one of them worse off. It represents the Pareto efficient allocations of goods between two individuals or entities,
Cornelius
Suppose a consumer consuming two commodities X and Y has The following utility function u=X0.4 Y0.6. If the price of the X and Y are 2 and 3 respectively and income Constraint is birr 50. A,Calculate quantities of x and y which maximize utility. B,Calculate value of Lagrange multiplier. C,Calculate quantities of X and Y consumed with a given price. D,alculate optimum level of output .
Feyisa Reply
Answer
Feyisa
c
Jabir
the market for lemon has 10 potential consumers, each having an individual demand curve p=101-10Qi, where p is price in dollar's per cup and Qi is the number of cups demanded per week by the i th consumer.Find the market demand curve using algebra. Draw an individual demand curve and the market dema
Gsbwnw Reply
suppose the production function is given by ( L, K)=L¼K¾.assuming capital is fixed find APL and MPL. consider the following short run production function:Q=6L²-0.4L³ a) find the value of L that maximizes output b)find the value of L that maximizes marginal product
Abdureman
Got questions? Join the online conversation and get instant answers!
Jobilize.com Reply

Get Jobilize Job Search Mobile App in your pocket Now!

Get it on Google Play Download on the App Store Now


Source:  OpenStax, Introductory statistics. OpenStax CNX. May 06, 2016 Download for free at http://legacy.cnx.org/content/col11562/1.18
Google Play and the Google Play logo are trademarks of Google Inc.

Notification Switch

Would you like to follow the 'Introductory statistics' conversation and receive update notifications?

Ask