<< Chapter < Page Chapter >> Page >

Try it

Students in a social studies class hypothesize that the literacy rates across the world for every region are 82%. [link] shows the actual literacy rates across the world broken down by region. What are the test statistic and the degrees of freedom?

MDG Region Adult Literacy Rate (%)
Developed Regions 99.0
Commonwealth of Independent States 99.5
Northern Africa 67.3
Sub-Saharan Africa 62.5
Latin America and the Caribbean 91.0
Eastern Asia 93.8
Southern Asia 61.9
South-Eastern Asia 91.9
Western Asia 84.5
Oceania 66.4

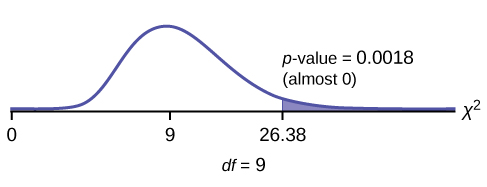
degrees of freedom = 9

chi 2 test statistic = 26.38

This is a nonsymmetric chi-square curve with df = 9. The values 0, 9, and 26.38 are labeled on the horizontal axis. The value 9 coincides with the peak of the curve. A vertical upward line extends from 26.38 to the curve, and the region to the right of this line is shaded. The shaded area is equal to the p-value.

Press STAT and ENTER . Make sure you clear lists L1, L2, and L3 if they have data in them. Into L1, put the observed frequencies 99, 99.5, 67.3, 62.5, 91, 93.8, 61.9, 91.9, 84.5, 66.4 . Into L2 , put the expected frequencies 82, 82, 82, 82, 82, 82, 82, 82, 82, 82 . Arrow over to list L3 and up to the name area "L3" . Enter (L1-L2)^2/L2 and ENTER . Press 2nd QUIT . Press 2nd LIST and arrow over to MATH . Press 5 . You should see "sum" . Enter L3 . Rounded to two decimal places, you should see 26.38 . Press 2nd DISTR . Arrow down to 7:χ2cdf (or press 7 ). Press ENTER . Enter 26.38,1E99,9) . Rounded to four places, you should see .0018 , which is the p -value.

The newer TI-84 calculators have in STAT TESTS the test Chi2 GOF . To run the test, put the observed values (the data) into a first list and the expected values (the values you expect if the null hypothesis is true) into a second list. Press STAT TESTS and Chi2 GOF . Enter the list names for the Observed list and the Expected list. Enter the degrees of freedom and press calculate or draw . Make sure you clear any lists before you start.

Got questions? Get instant answers now!

References

Data from the U.S. Census Bureau

Data from the College Board. Available online at http://www.collegeboard.com.

Data from the U.S. Census Bureau, Current Population Reports.

Ma, Y., E.R. Bertone, E.J. Stanek III, G.W. Reed, J.R. Hebert, N.L. Cohen, P.A. Merriam, I.S. Ockene, “Association between Eating Patterns and Obesity in a Free-living US Adult Population.” American Journal of Epidemiology volume 158, no. 1, pages 85-92.

Ogden, Cynthia L., Margaret D. Carroll, Brian K. Kit, Katherine M. Flegal, “Prevalence of Obesity in the United States, 2009–2010.” NCHS Data Brief no. 82, January 2012. Available online at http://www.cdc.gov/nchs/data/databriefs/db82.pdf (accessed May 24, 2013).

Stevens, Barbara J., “Multi-family and Commercial Solid Waste and Recycling Survey.” Arlington Count, VA. Available online at http://www.arlingtonva.us/departments/EnvironmentalServices/SW/file84429.pdf (accessed May 24,2013).

Chapter review

To assess whether a data set fits a specific distribution, you can apply the goodness-of-fit hypothesis test that uses the chi-square distribution. The null hypothesis for this test states that the data come from the assumed distribution. The test compares observed values against the values you would expect to have if your data followed the assumed distribution. The test is almost always right-tailed. Each observation or cell category must have an expected value of at least five.

Questions & Answers

What are the factors that affect demand for a commodity
Florence Reply
differentiate between demand and supply giving examples
Lambiv Reply
differentiated between demand and supply using examples
Lambiv
what is labour ?
Lambiv
how will I do?
Venny Reply
how is the graph works?I don't fully understand
Rezat Reply
information
Eliyee
devaluation
Eliyee
t
WARKISA
hi guys good evening to all
Lambiv
multiple choice question
Aster Reply
appreciation
Eliyee
explain perfect market
Lindiwe Reply
In economics, a perfect market refers to a theoretical construct where all participants have perfect information, goods are homogenous, there are no barriers to entry or exit, and prices are determined solely by supply and demand. It's an idealized model used for analysis,
Ezea
What is ceteris paribus?
Shukri Reply
other things being equal
AI-Robot
When MP₁ becomes negative, TP start to decline. Extuples Suppose that the short-run production function of certain cut-flower firm is given by: Q=4KL-0.6K2 - 0.112 • Where is quantity of cut flower produced, I is labour input and K is fixed capital input (K-5). Determine the average product of lab
Kelo
Extuples Suppose that the short-run production function of certain cut-flower firm is given by: Q=4KL-0.6K2 - 0.112 • Where is quantity of cut flower produced, I is labour input and K is fixed capital input (K-5). Determine the average product of labour (APL) and marginal product of labour (MPL)
Kelo
yes,thank you
Shukri
Can I ask you other question?
Shukri
what is monopoly mean?
Habtamu Reply
What is different between quantity demand and demand?
Shukri Reply
Quantity demanded refers to the specific amount of a good or service that consumers are willing and able to purchase at a give price and within a specific time period. Demand, on the other hand, is a broader concept that encompasses the entire relationship between price and quantity demanded
Ezea
ok
Shukri
how do you save a country economic situation when it's falling apart
Lilia Reply
what is the difference between economic growth and development
Fiker Reply
Economic growth as an increase in the production and consumption of goods and services within an economy.but Economic development as a broader concept that encompasses not only economic growth but also social & human well being.
Shukri
production function means
Jabir
What do you think is more important to focus on when considering inequality ?
Abdisa Reply
any question about economics?
Awais Reply
sir...I just want to ask one question... Define the term contract curve? if you are free please help me to find this answer 🙏
Asui
it is a curve that we get after connecting the pareto optimal combinations of two consumers after their mutually beneficial trade offs
Awais
thank you so much 👍 sir
Asui
In economics, the contract curve refers to the set of points in an Edgeworth box diagram where both parties involved in a trade cannot be made better off without making one of them worse off. It represents the Pareto efficient allocations of goods between two individuals or entities, where neither p
Cornelius
In economics, the contract curve refers to the set of points in an Edgeworth box diagram where both parties involved in a trade cannot be made better off without making one of them worse off. It represents the Pareto efficient allocations of goods between two individuals or entities,
Cornelius
Suppose a consumer consuming two commodities X and Y has The following utility function u=X0.4 Y0.6. If the price of the X and Y are 2 and 3 respectively and income Constraint is birr 50. A,Calculate quantities of x and y which maximize utility. B,Calculate value of Lagrange multiplier. C,Calculate quantities of X and Y consumed with a given price. D,alculate optimum level of output .
Feyisa Reply
Answer
Feyisa
c
Jabir
the market for lemon has 10 potential consumers, each having an individual demand curve p=101-10Qi, where p is price in dollar's per cup and Qi is the number of cups demanded per week by the i th consumer.Find the market demand curve using algebra. Draw an individual demand curve and the market dema
Gsbwnw Reply
suppose the production function is given by ( L, K)=L¼K¾.assuming capital is fixed find APL and MPL. consider the following short run production function:Q=6L²-0.4L³ a) find the value of L that maximizes output b)find the value of L that maximizes marginal product
Abdureman
Got questions? Join the online conversation and get instant answers!
Jobilize.com Reply

Get Jobilize Job Search Mobile App in your pocket Now!

Get it on Google Play Download on the App Store Now


Source:  OpenStax, Introductory statistics. OpenStax CNX. May 06, 2016 Download for free at http://legacy.cnx.org/content/col11562/1.18
Google Play and the Google Play logo are trademarks of Google Inc.

Notification Switch

Would you like to follow the 'Introductory statistics' conversation and receive update notifications?

Ask