| << Chapter < Page | Chapter >> Page > |
A concerned group of citizens wanted to know if the proportion of forcible rapes in Texas was different in 2011 than in 2010. Their research showed that of the 113,231 violent crimes in Texas in 2010, 7,622 of them were forcible rapes. In 2011, 7,439 of the 104,873 violent crimes were in the forcible rape category. Test at a 5% significance level. Answer the following questions:
a. Is this a test of two means or two proportions?
a. two proportions
b. Which distribution do you use to perform the test?
b. normal for two proportions
c. What is the random variable?
c. Subscripts: 1 = 2010, 2 = 2011
P ′
2 -
P ′
2
d. What are the null and alternative hypothesis? Write the null and alternative hypothesis in symbols.
d. Subscripts: 1 = 2010, 2 = 2011
H
0 :
p
1 =
p
2
H
0 :
p
1 −
p
2 = 0
H
a :
p
1 ≠
p
2
H
a :
p
1 −
p
2 ≠ 0
g. Do you reject or not reject the null hypothesis?
g. Reject the H 0 .
h. At the ___ level of significance, from the sample data, there ______ (is/is not) sufficient evidence to conclude that ____________.
h. At the 5% significance level, from the sample data, there is sufficient evidence to conclude that there is a difference between the proportion of forcible rapes in 2011 and 2010.
Data from Educational Resources , December catalog.
Data from Hilton Hotels. Available online at http://www.hilton.com (accessed June 17, 2013).
Data from Hyatt Hotels. Available online at http://hyatt.com (accessed June 17, 2013).
Data from Statistics, United States Department of Health and Human Services.
Data from Whitney Exhibit on loan to San Jose Museum of Art.
Data from the American Cancer Society. Available online at http://www.cancer.org/index (accessed June 17, 2013).
Data from the Chancellor’s Office, California Community Colleges, November 1994.
“State of the States.” Gallup, 2013. Available online at http://www.gallup.com/poll/125066/State-States.aspx?ref=interactive (accessed June 17, 2013).
“West Nile Virus.” Centers for Disease Control and Prevention. Available online at http://www.cdc.gov/ncidod/dvbid/westnile/index.htm (accessed June 17, 2013).
Test of two population proportions from independent samples.
Pooled Proportion: p c =
Distribution for the differences:
where the null hypothesis is H 0 : p A = p B or H 0 : p A – p B = 0.
Test Statistic ( z -score):
where the null hypothesis is H 0 : p A = p B or H 0 : p A − p B = 0.
where
p′ A and p′ B are the sample proportions, p A and p B are the population proportions,
P c is the pooled proportion, and n A and n B are the sample sizes.
Use the following information for the next five exercises. Two types of phone operating system are being tested to determine if there is a difference in the proportions of system failures (crashes). Fifteen out of a random sample of 150 phones with OS 1 had system failures within the first eight hours of operation. Nine out of another random sample of 150 phones with OS 2 had system failures within the first eight hours of operation. OS 2 is believed to be more stable (have fewer crashes) than OS 1 .
Is this a test of means or proportions?
What is the random variable?
P ′ OS1 – P ′ OS2 = difference in the proportions of phones that had system failures within the first eight hours of operation with OS 1 and OS 2 .
State the null and alternative hypotheses.
What can you conclude about the two operating systems?
Use the following information to answer the next twelve exercises. In the recent Census, three percent of the U.S. population reported being of two or more races. However, the percent varies tremendously from state to state. Suppose that two random surveys are conducted. In the first random survey, out of 1,000 North Dakotans, only nine people reported being of two or more races. In the second random survey, out of 500 Nevadans, 17 people reported being of two or more races. Conduct a hypothesis test to determine if the population percents are the same for the two states or if the percent for Nevada is statistically higher than for North Dakota.
State the null and alternative hypotheses.
Is this a right-tailed, left-tailed, or two-tailed test? How do you know?
right-tailed
What is the random variable of interest for this test?
In words, define the random variable for this test.
The random variable is the difference in proportions (percents) of the populations that are of two or more races in Nevada and North Dakota.
Which distribution (normal or Student's t ) would you use for this hypothesis test?
Explain why you chose the distribution you did for the Exercise 10.56 .
Our sample sizes are much greater than five each, so we use the normal for two proportions distribution for this hypothesis test.
Calculate the test statistic.
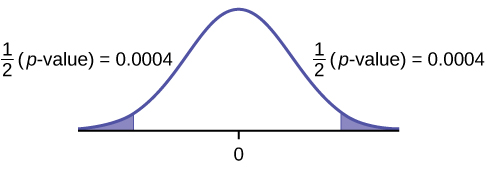
Sketch a graph of the situation. Mark the hypothesized difference and the sample difference. Shade the area corresponding to the
p -value.

Check student’s solution.
Find the p -value.
At a pre-conceived α = 0.05, what is your:
Does it appear that the proportion of Nevadans who are two or more races is higher than the proportion of North Dakotans? Why or why not?
Notification Switch
Would you like to follow the 'Introductory statistics' conversation and receive update notifications?

|
|

|
|

|
|

|
|

|
|

|
|

|
|

|
|

|
|

|
|

|