<< Chapter < Page Chapter >> Page >

The data are the colors of backpacks. Again, you sample the same five students. One student has a red backpack, two students have black backpacks, one student has a green backpack, and one student has a gray backpack. The colors red, black, black, green, and gray are qualitative data.

Got questions? Get instant answers now!

Try it

The data are the colors of houses. You sample five houses. The colors of the houses are white, yellow, white, red, and white. What type of data is this?

Try it solutions

qualitative data

Got questions? Get instant answers now!

Note

You may collect data as numbers and report it categorically. For example, the quiz scores for each student are recorded throughout the term. At the end of the term, the quiz scores are reported as A, B, C, D, or F.

Work collaboratively to determine the correct data type (quantitative or qualitative). Indicate whether quantitative data are continuous or discrete. Hint: Data that are discrete often start with the words "the number of."

  1. the number of pairs of shoes you own
  2. the type of car you drive
  3. where you go on vacation
  4. the distance it is from your home to the nearest grocery store
  5. the number of classes you take per school year.
  6. the tuition for your classes
  7. the type of calculator you use
  8. movie ratings
  9. political party preferences
  10. weights of sumo wrestlers
  11. amount of money (in dollars) won playing poker
  12. number of correct answers on a quiz
  13. peoples’ attitudes toward the government
  14. IQ scores (This may cause some discussion.)

Items a, e, f, k, and l are quantitative discrete; items d, j, and n are quantitative continuous; items b, c, g, h, i, and m are qualitative.

Got questions? Get instant answers now!

Try it

Determine the correct data type (quantitative or qualitative) for the number of cars in a parking lot. Indicate whether quantitative data are continuous or discrete.

Try it solutions

quantitative discrete

Got questions? Get instant answers now!

A statistics professor collects information about the classification of her students as freshmen, sophomores, juniors, or seniors. The data she collects are summarized in the pie chart [link] . What type of data does this graph show?

This is a pie chart showing the class classification of statistics students. The chart has 4 sections labeled Freshman, Sophomore, Junior, Senior. A question is asked below the pie chart: what type of data does this graph show?

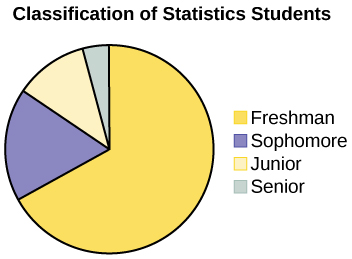
This pie chart shows the students in each year, which is qualitative data .

Got questions? Get instant answers now!

Try it

The registrar at State University keeps records of the number of credit hours students complete each semester. The data he collects are summarized in the histogram. The class boundaries are 10 to less than 13, 13 to less than 16, 16 to less than 19, 19 to less than 22, and 22 to less than 25.

This histogram consists of 5 bars with the x-axis marked at intervals of 3 from 10 - 25, and the y-axis in increments of 100 from 0 - 800. The height of bars shows the number of students in each interval.

What type of data does this graph show?

Try it solutions

A histogram is used to display quantitative data: the numbers of credit hours completed. Because students can complete only a whole number of hours (no fractions of hours allowed), this data is quantitative discrete.

Got questions? Get instant answers now!

Qualitative data discussion

Below are tables comparing the number of part-time and full-time students at De Anza College and Foothill College enrolled for the spring 2010 quarter. The tables display counts (frequencies) and percentages or proportions (relative frequencies). The percent columns make comparing the same categories in the colleges easier. Displaying percentages along with the numbers is often helpful, but it is particularly important when comparing sets of data that do not have the same totals, such as the total enrollments for both colleges in this example. Notice how much larger the percentage for part-time students at Foothill College is compared to De Anza College.

Questions & Answers

Ayele, K., 2003. Introductory Economics, 3rd ed., Addis Ababa.
Widad Reply
can you send the book attached ?
Ariel
?
Ariel
What is economics
Widad Reply
the study of how humans make choices under conditions of scarcity
AI-Robot
U(x,y) = (x×y)1/2 find mu of x for y
Desalegn Reply
U(x,y) = (x×y)1/2 find mu of x for y
Desalegn
what is ecnomics
Jan Reply
this is the study of how the society manages it's scarce resources
Belonwu
what is macroeconomic
John Reply
macroeconomic is the branch of economics which studies actions, scale, activities and behaviour of the aggregate economy as a whole.
husaini
etc
husaini
difference between firm and industry
husaini Reply
what's the difference between a firm and an industry
Abdul
firm is the unit which transform inputs to output where as industry contain combination of firms with similar production 😅😅
Abdulraufu
Suppose the demand function that a firm faces shifted from Qd  120 3P to Qd  90  3P and the supply function has shifted from QS  20  2P to QS 10  2P . a) Find the effect of this change on price and quantity. b) Which of the changes in demand and supply is higher?
Toofiq Reply
explain standard reason why economic is a science
innocent Reply
factors influencing supply
Petrus Reply
what is economic.
Milan Reply
scares means__________________ends resources. unlimited
Jan
economics is a science that studies human behaviour as a relationship b/w ends and scares means which have alternative uses
Jan
calculate the profit maximizing for demand and supply
Zarshad Reply
Why qualify 28 supplies
Milan
what are explicit costs
Nomsa Reply
out-of-pocket costs for a firm, for example, payments for wages and salaries, rent, or materials
AI-Robot
concepts of supply in microeconomics
David Reply
economic overview notes
Amahle Reply
identify a demand and a supply curve
Salome Reply
i don't know
Parul
there's a difference
Aryan
Demand curve shows that how supply and others conditions affect on demand of a particular thing and what percent demand increase whith increase of supply of goods
Israr
Hi Sir please how do u calculate Cross elastic demand and income elastic demand?
Abari
Got questions? Join the online conversation and get instant answers!
Jobilize.com Reply

Get Jobilize Job Search Mobile App in your pocket Now!

Get it on Google Play Download on the App Store Now


Source:  OpenStax, Introductory statistics. OpenStax CNX. May 06, 2016 Download for free at http://legacy.cnx.org/content/col11562/1.18
Google Play and the Google Play logo are trademarks of Google Inc.

Notification Switch

Would you like to follow the 'Introductory statistics' conversation and receive update notifications?

Ask