An emergency room at a particular hospital gets an average of five patients per hour. A doctor wants to know the probability that the ER gets more than five patients per hour. Give the reason why this would be a Poisson distribution.
This problem wants to find the probability of events occurring in a fixed interval of time with a known average rate. The events are independent.
Notation for the poisson: p = poisson probability distribution function
X ~
P (
μ )
Read this as "
X is a random variable with a Poisson distribution." The parameter is
μ (or
λ );
μ (or
λ ) = the mean for the interval of interest.
Leah's answering machine receives about six telephone calls between 8 a.m. and 10 a.m. What is the probability that Leah receives more than one call
in the next 15 minutes?
Let
X = the number of calls Leah receives in 15 minutes. (The
interval of interest is 15 minutes or
hour.)
x = 0, 1, 2, 3, ...
If Leah receives, on the average, six telephone calls in two hours, and there are eight 15 minute intervals in two hours, then Leah receives
(6) = 0.75 calls in 15 minutes, on average. So,
μ = 0.75 for this problem.
X ~
P (0.75)
Find
P (
x >1).
P (
x >1) = 0.1734 (calculator or computer)
Press 1 – and then press 2
nd DISTR.
Arrow down to poissoncdf. Press ENTER.
Enter (.75,1).
The result is
P (
x >1) = 0.1734.
Note
The TI calculators use
λ (lambda) for the mean.
The probability that Leah receives more than one telephone call in the next 15 minutes is about 0.1734:
P (
x >1) = 1 − poissoncdf(0.75, 1).
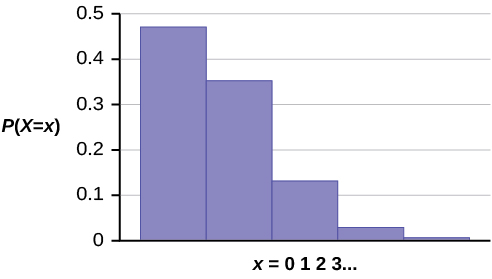
The graph of
X ~
P (0.75) is:
The
y -axis contains the probability of
x where
X = the number of calls in 15 minutes.
A customer service center receives about ten emails every half-hour. What is the probability that the customer service center receives more than four emails in the next six minutes? Use the TI-83+ or TI-84 calculator to find the answer.
According to Baydin, an email management company, an email user gets, on average, 147 emails per day. Let
X = the number of emails an email user receives per day. The discrete random variable
X takes on the values
x = 0, 1, 2 …. The random variable
X has a Poisson distribution:
X ~
P (147). The mean is 147 emails.
What is the probability that an email user receives exactly 160 emails per day?
What is the probability that an email user receives at most 160 emails per day?
According to a recent poll by the Pew Internet Project, girls between the ages of 14 and 17 send an average of 187 text messages each day. Let
X = the number of texts that a girl aged 14 to 17 sends per day. The discrete random variable
X takes on the values
x = 0, 1, 2 …. The random variable
X has a Poisson distribution:
X ~
P (187). The mean is 187 text messages.
What is the probability that a teen girl sends exactly 175 texts per day?
What is the probability that a teen girl sends at most 150 texts per day?
Step 1: Find the mean. To find the mean, add up all the scores, then divide them by the number of scores. ...
Step 2: Find each score's deviation from the mean. ...
Step 3: Square each deviation from the mean. ...
Step 4: Find the sum of squares. ...
Step 5: Divide the sum of squares by n – 1 or N.
The sample of 16 students is taken. The average age in the sample was 22 years with astandard deviation of 6 years. Construct a 95% confidence interval for the age of the population.
Bhartdarshan' is an internet-based travel agency wherein customer can see videos of the cities they plant to visit. The number of hits daily is a normally distributed random variable with a mean of 10,000 and a standard deviation of 2,400
a. what is the probability of getting more than 12,000 hits?
b. what is the probability of getting fewer than 9,000 hits?
Bhartdarshan'is an internet-based travel agency wherein customer can see videos of the cities they plan to visit. The number of hits daily is a normally distributed random variable with a mean of 10,000 and a standard deviation of 2,400.
a. What is the probability of getting more than 12,000 hits