<< Chapter < Page Chapter >> Page >

A fair coin is flipped 15 times. Each flip is independent. What is the probability of getting more than ten heads? Let X = the number of heads in 15 flips of the fair coin. X takes on the values 0, 1, 2, 3, ..., 15. Since the coin is fair, p = 0.5 and q = 0.5. The number of trials is n = 15. State the probability question mathematically.

P ( x >10)

Got questions? Get instant answers now!

Try it

A fair, six-sided die is rolled ten times. Each roll is independent. You want to find the probability of rolling a one more than three times. State the probability question mathematically.

P ( x >3)

Got questions? Get instant answers now!

Approximately 70% of statistics students do their homework in time for it to be collected and graded. Each student does homework independently. In a statistics class of 50 students, what is the probability that at least 40 will do their homework on time? Students are selected randomly.

a. This is a binomial problem because there is only a success or a __________, there are a fixed number of trials, and the probability of a success is 0.70 for each trial.

a. failure

Got questions? Get instant answers now!

b. If we are interested in the number of students who do their homework on time, then how do we define X ?

b. X = the number of statistics students who do their homework on time

Got questions? Get instant answers now!

c. What values does x take on?

c. 0, 1, 2, …, 50

Got questions? Get instant answers now!

d. What is a "failure," in words?

d. Failure is defined as a student who does not complete his or her homework on time.

The probability of a success is p = 0.70. The number of trials is n = 50.

Got questions? Get instant answers now!

e. If p + q = 1, then what is q ?

e. q = 0.30

Got questions? Get instant answers now!

f. The words "at least" translate as what kind of inequality for the probability question P ( x ____ 40).

f. greater than or equal to (≥)
The probability question is P ( x ≥ 40).

Got questions? Get instant answers now!

Try it

Sixty-five percent of people pass the state driver’s exam on the first try. A group of 50 individuals who have taken the driver’s exam is randomly selected. Give two reasons why this is a binomial problem.

This is a binomial problem because there is only a success or a failure, and there are a definite number of trials. The probability of a success stays the same for each trial.

Got questions? Get instant answers now!

Notation for the binomial: B = binomial probability distribution function

X ~ B ( n , p )

Read this as " X is a random variable with a binomial distribution." The parameters are n and p ; n = number of trials, p = probability of a success on each trial.

It has been stated that about 41% of adult workers have a high school diploma but do not pursue any further education. If 20 adult workers are randomly selected, find the probability that at most 12 of them have a high school diploma but do not pursue any further education. How many adult workers do you expect to have a high school diploma but do not pursue any further education?

Let X = the number of workers who have a high school diploma but do not pursue any further education.

X takes on the values 0, 1, 2, ..., 20 where n = 20, p = 0.41, and q = 1 – 0.41 = 0.59. X ~ B (20, 0.41)

Find P ( x ≤ 12). P ( x ≤ 12) = 0.9738. (calculator or computer)

Go into 2 nd DISTR. The syntax for the instructions are as follows:

To calculate ( x = value): binompdf( n , p , number) if "number" is left out, the result is the binomial probability table.
To calculate P ( x ≤ value): binomcdf( n , p , number) if "number" is left out, the result is the cumulative binomial probability table.
For this problem: After you are in 2 nd DISTR, arrow down to binomcdf. Press ENTER. Enter 20,0.41,12). The result is P ( x ≤ 12) = 0.9738.

Note

If you want to find P ( x = 12), use the pdf (binompdf). If you want to find P ( x >12), use 1 - binomcdf(20,0.41,12).

The probability that at most 12 workers have a high school diploma but do not pursue any further education is 0.9738.

The graph of X ~ B (20, 0.41) is as follows:

This histogram shows a binomial probability distribution. It is made up of bars that are fairly normally distributed. The x-axis shows values from 0 to 20. The y-axis shows values from 0 to 0.2 in increments of 0.05.

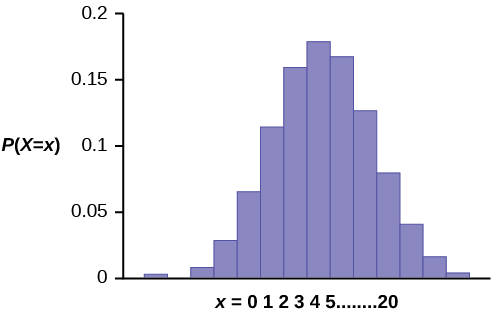
The y -axis contains the probability of x , where X = the number of workers who have only a high school diploma.

The number of adult workers that you expect to have a high school diploma but not pursue any further education is the mean, μ = np = (20)(0.41) = 8.2.

The formula for the variance is σ 2 = npq . The standard deviation is σ = n p q .
σ = ( 20 ) ( 0.41 ) ( 0.59 ) = 2.20.

Got questions? Get instant answers now!

Questions & Answers

What are the factors that affect demand for a commodity
Florence Reply
differentiate between demand and supply giving examples
Lambiv Reply
differentiated between demand and supply using examples
Lambiv
what is labour ?
Lambiv
how will I do?
Venny Reply
how is the graph works?I don't fully understand
Rezat Reply
information
Eliyee
devaluation
Eliyee
t
WARKISA
hi guys good evening to all
Lambiv
multiple choice question
Aster Reply
appreciation
Eliyee
explain perfect market
Lindiwe Reply
In economics, a perfect market refers to a theoretical construct where all participants have perfect information, goods are homogenous, there are no barriers to entry or exit, and prices are determined solely by supply and demand. It's an idealized model used for analysis,
Ezea
What is ceteris paribus?
Shukri Reply
other things being equal
AI-Robot
When MP₁ becomes negative, TP start to decline. Extuples Suppose that the short-run production function of certain cut-flower firm is given by: Q=4KL-0.6K2 - 0.112 • Where is quantity of cut flower produced, I is labour input and K is fixed capital input (K-5). Determine the average product of lab
Kelo
Extuples Suppose that the short-run production function of certain cut-flower firm is given by: Q=4KL-0.6K2 - 0.112 • Where is quantity of cut flower produced, I is labour input and K is fixed capital input (K-5). Determine the average product of labour (APL) and marginal product of labour (MPL)
Kelo
yes,thank you
Shukri
Can I ask you other question?
Shukri
what is monopoly mean?
Habtamu Reply
What is different between quantity demand and demand?
Shukri Reply
Quantity demanded refers to the specific amount of a good or service that consumers are willing and able to purchase at a give price and within a specific time period. Demand, on the other hand, is a broader concept that encompasses the entire relationship between price and quantity demanded
Ezea
ok
Shukri
how do you save a country economic situation when it's falling apart
Lilia Reply
what is the difference between economic growth and development
Fiker Reply
Economic growth as an increase in the production and consumption of goods and services within an economy.but Economic development as a broader concept that encompasses not only economic growth but also social & human well being.
Shukri
production function means
Jabir
What do you think is more important to focus on when considering inequality ?
Abdisa Reply
any question about economics?
Awais Reply
sir...I just want to ask one question... Define the term contract curve? if you are free please help me to find this answer 🙏
Asui
it is a curve that we get after connecting the pareto optimal combinations of two consumers after their mutually beneficial trade offs
Awais
thank you so much 👍 sir
Asui
In economics, the contract curve refers to the set of points in an Edgeworth box diagram where both parties involved in a trade cannot be made better off without making one of them worse off. It represents the Pareto efficient allocations of goods between two individuals or entities, where neither p
Cornelius
In economics, the contract curve refers to the set of points in an Edgeworth box diagram where both parties involved in a trade cannot be made better off without making one of them worse off. It represents the Pareto efficient allocations of goods between two individuals or entities,
Cornelius
Suppose a consumer consuming two commodities X and Y has The following utility function u=X0.4 Y0.6. If the price of the X and Y are 2 and 3 respectively and income Constraint is birr 50. A,Calculate quantities of x and y which maximize utility. B,Calculate value of Lagrange multiplier. C,Calculate quantities of X and Y consumed with a given price. D,alculate optimum level of output .
Feyisa Reply
Answer
Feyisa
c
Jabir
the market for lemon has 10 potential consumers, each having an individual demand curve p=101-10Qi, where p is price in dollar's per cup and Qi is the number of cups demanded per week by the i th consumer.Find the market demand curve using algebra. Draw an individual demand curve and the market dema
Gsbwnw Reply
suppose the production function is given by ( L, K)=L¼K¾.assuming capital is fixed find APL and MPL. consider the following short run production function:Q=6L²-0.4L³ a) find the value of L that maximizes output b)find the value of L that maximizes marginal product
Abdureman
Got questions? Join the online conversation and get instant answers!
Jobilize.com Reply

Get Jobilize Job Search Mobile App in your pocket Now!

Get it on Google Play Download on the App Store Now


Source:  OpenStax, Introductory statistics. OpenStax CNX. May 06, 2016 Download for free at http://legacy.cnx.org/content/col11562/1.18
Google Play and the Google Play logo are trademarks of Google Inc.

Notification Switch

Would you like to follow the 'Introductory statistics' conversation and receive update notifications?

Ask