Home
Introductory statistics Introductory statistics
Notes for the ti-83, 83+, 84,
To deselect equations:
Access the list of equations.
Select each equal sign (=).
Continue, until all equations are deselected.
To clear equations:
Access the list of equations.
Use the arrow keys to navigate to the right of each equal sign (=) and clear them.
Repeat until all equations are deleted.
To draw default histogram:
Access the ZOOM menu.
Select
<9:ZoomStat> .
The histogram will show with a window automatically set.
To draw custom histogram:
Access window mode to set the graph parameters.
X
min
=
–2.5
X
max
=
3.5
X
s
c
l
=
1 (width of bars)
Y
min
=
0
Y
max
=
10
Y
s
c
l
=
1 (spacing of tick marks on
y -axis)
X
r
e
s
=
1
Access graphing mode to see the histogram.
To draw box plots:
Access graphing mode.
,
[STAT PLOT]
Select
<1:Plot 1> to access the first graph.
Use the arrows to select
<ON> and turn on Plot 1.
Use the arrows to select the box plot picture and enable it.
Use the arrows to navigate to
<Xlist> .
If "L1" is not selected, select it.
,
[L1] ,
Use the arrows to navigate to
<Freq> .
Indicate that the frequencies are in
[L2] .
,
[L2] ,
Go back to access other graphs.
,
[STAT PLOT]
Be sure to deselect or clear all equations before graphing using the method mentioned above.
View the box plot.
,
[STAT PLOT]
Linear regression
Sample data
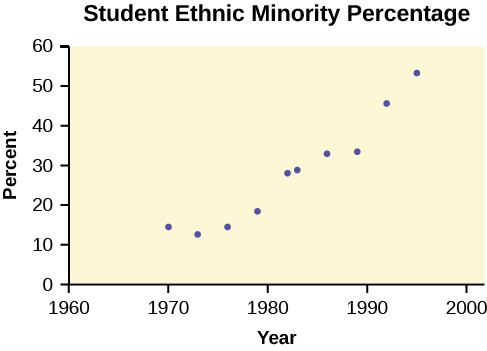
The following data is real. The percent of declared ethnic minority students at De Anza College for selected years from 1970–1995 was:
Year
Student Ethnic Minority Percentage
1970
14.13
1973
12.27
1976
14.08
1979
18.16
1982
27.64
1983
28.72
1986
31.86
1989
33.14
1992
45.37
1995
53.1
The independent variable is "Year," while the independent variable is "Student Ethnic Minority Percent."
Student ethnic minority percentage
By hand, verify the scatterplot above.
Note
The TI-83 has a built-in linear regression feature, which allows the data to be edited.The
x -values will be in
[L1] ; the
y -values in
[L2] .
To enter data and do linear regression:
ON Turns calculator on.
Before accessing this program, be sure to turn off all plots.
Round to three decimal places. To do so:
Access the mode menu.
,
[STAT PLOT]
Navigate to
<Float> and then to the right to
<3> .
All numbers will be rounded to three decimal places until changed.
Enter statistics mode and clear lists
[L1] and
[L2] , as describe previously.
,
Enter editing mode to insert values for
x and
y .
,
Enter each value. Press
to continue.
To display the correlation coefficient:
Access the catalog.
,
[CATALOG]
Arrow down and select
<DiagnosticOn>
... ,
,
r and
r
2 will be displayed during regression calculations.
Access linear regression.
Select the form of
y =
a +
bx .
,
Linreg
y =
a +
bx
a = –3176.909
b = 1.617
r = 2 0.924
r = 0.961
y = –3176.909 + 1.617
x
Percent = –3176.909 + 1.617 (year #) The correlation coefficient
r = 0.961
To see the scatter plot:
Access graphing mode.
,
[STAT PLOT]
Select
<1:plot 1> To access plotting - first graph.
Navigate and select
<ON> to turn on Plot 1.
<ON>
Navigate to the first picture.
Select the scatter plot.
Navigate to
<Xlist> .
If
[L1] is not selected, press
,
[L1] to select it.
Confirm that the data values are in
[L1] .
<ON>
Navigate to
<Ylist> .
Select that the frequencies are in
[L2] .
,
[L2] ,
Go back to access other graphs.
,
[STAT PLOT]
Use the arrows to turn off the remaining plots.
Access window mode to set the graph parameters.
X
min
=
1970
X
max
=
2000
X
s
c
l
=
10 (spacing of tick marks on
x -axis)
Y
min
=
−
0.05
Y
max
=
60
Y
s
c
l
=
10 (spacing of tick marks on
y -axis)
X
r
e
s
=
1
Be sure to deselect or clear all equations before graphing, using the instructions above.
Press the graph button to see the scatter plot.
Questions & Answers
evolutionary history and relationship of an organism or group of organisms
AI-Robot
the study of living organisms and their interactions with one another and their environments
AI-Robot
HOW CAN MAN ORGAN FUNCTION
the diagram of the digestive system
allimentary cannel
Ogenrwot
They formed in two ways first when one sperm and one egg are splited by mitosis or two sperm and two eggs join together
Oluwatobi
Genetics is the study of heredity
Misack
how does twins formed?
Misack
discuss biological phenomenon and provide pieces of evidence to show that it was responsible for the formation of eukaryotic organelles
the study of living organisms and their interactions with one another and their environment.
Wine
discuss the biological phenomenon and provide pieces of evidence to show that it was responsible for the formation of eukaryotic organelles in an essay form
list any five characteristics of the blood cells
Shaker
lack electricity and its more savely than electronic microscope because its naturally by using of light
advantage of electronic microscope is easily and clearly while disadvantage is dangerous because its electronic. advantage of light microscope is savely and naturally by sun while disadvantage is not easily,means its not sharp and not clear
Abdullahi
cell theory state that every organisms composed of one or more cell,cell is the basic unit of life
Abdullahi
is like gone fail us
DENG
cells is the basic structure and functions of all living things
Ramadan
is organisms that are similar into groups called tara
Yamosa
in what situation (s) would be the use of a scanning electron microscope be ideal and why?
A scanning electron microscope (SEM) is ideal for situations requiring high-resolution imaging of surfaces. It is commonly used in materials science, biology, and geology to examine the topography and composition of samples at a nanoscale level. SEM is particularly useful for studying fine details,
Hilary
Got questions? Join the online conversation and get instant answers!
Source:
OpenStax, Introductory statistics. OpenStax CNX. May 06, 2016 Download for free at http://legacy.cnx.org/content/col11562/1.18
Google Play and the Google Play logo are trademarks of Google Inc.