<< Chapter < Page Chapter >> Page >

Go to [link] . There are calculator instructions for entering data and for creating a customized histogram. Create the histogram for [link] .

  • Press Y=. Press CLEAR to delete any equations.
  • Press STAT 1:EDIT. If L1 has data in it, arrow up into the name L1, press CLEAR and then arrow down. If necessary, do the same for L2.
  • Into L1, enter 1, 2, 3, 4, 5, 6.
  • Into L2, enter 11, 10, 16, 6, 5, 2.
  • Press WINDOW. Set Xmin = .5, Xscl = (6.5 – .5)/6, Ymin = –1, Ymax = 20, Yscl = 1, Xres = 1.
  • Press 2 nd Y=. Start by pressing 4:Plotsoff ENTER.
  • Press 2 nd Y=. Press 1:Plot1. Press ENTER. Arrow down to TYPE. Arrow to the 3 rd picture (histogram). Press ENTER.
  • Arrow down to Xlist: Enter L1 (2 nd 1). Arrow down to Freq. Enter L2 (2 nd 2).
  • Press GRAPH.
  • Use the TRACE key and the arrow keys to examine the histogram.

Try it

The following data are the number of sports played by 50 student athletes. The number of sports is discrete data since sports are counted.

1; 1; 1; 1; 1; 1; 1; 1; 1; 1; 1; 1; 1; 1; 1; 1; 1; 1; 1; 1
2; 2; 2; 2; 2; 2; 2; 2; 2; 2; 2; 2; 2; 2; 2; 2; 2; 2; 2; 2; 2; 2
3; 3; 3; 3; 3; 3; 3; 3
20 student athletes play one sport. 22 student athletes play two sports. Eight student athletes play three sports.

Fill in the blanks for the following sentence. Since the data consist of the numbers 1, 2, 3, and the starting point is 0.5, a width of one places the 1 in the middle of the interval 0.5 to _____, the 2 in the middle of the interval from _____ to _____, and the 3 in the middle of the interval from _____ to _____.

1.5
1.5 to 2.5
2.5 to 3.5

Got questions? Get instant answers now!

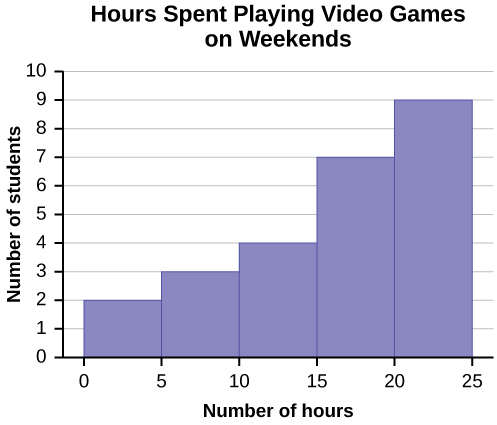
Using this data set, construct a histogram.

Number of Hours My Classmates Spent Playing Video Games on Weekends
9.95 10 2.25 16.75 0
19.5 22.5 7.5 15 12.75
5.5 11 10 20.75 17.5
23 21.9 24 23.75 18
20 15 22.9 18.8 20.5
This is a histogram that matches the supplied data. The x-axis consists of 5 bars in intervals of 5 from 0 to 25. The y-axis is marked in increments of 1 from 0 to 10. The x-axis shows the number of hours spent playing video games on the weekends, and the y-axis shows the number of students.

Some values in this data set fall on boundaries for the class intervals. A value is counted in a class interval if it falls on the left boundary, but not if it falls on the right boundary. Different researchers may set up histograms for the same data in different ways. There is more than one correct way to set up a histogram.

Got questions? Get instant answers now!

Try it

The following data represent the number of employees at various restaurants in New York City. Using this data, create a histogram.

  • 22
  • 35
  • 15
  • 26
  • 40
  • 28
  • 18
  • 20
  • 25
  • 34
  • 39
  • 42
  • 24
  • 22
  • 19
  • 27
  • 22
  • 34
  • 40
  • 20
  • 38
  • and 28

Use 10–19 as the first interval.

Got questions? Get instant answers now!

Count the money (bills and change) in your pocket or purse. Your instructor will record the amounts. As a class, construct a histogram displaying the data. Discuss how many intervals you think is appropriate. You may want to experiment with the number of intervals.

Frequency polygons

Frequency polygons are analogous to line graphs, and just as line graphs make continuous data visually easy to interpret, so too do frequency polygons.

To construct a frequency polygon, first examine the data and decide on the number of intervals, or class intervals, to use on the x -axis and y -axis. After choosing the appropriate ranges, begin plotting the data points. After all the points are plotted, draw line segments to connect them.

A frequency polygon was constructed from the frequency table below.

Frequency Distribution for Calculus Final Test Scores
Lower Bound Upper Bound Frequency Cumulative Frequency
49.5 59.5 5 5
59.5 69.5 10 15
69.5 79.5 30 45
79.5 89.5 40 85
89.5 99.5 15 100
A frequency polygon was constructed from the frequency table below.

The first label on the x -axis is 44.5. This represents an interval extending from 39.5 to 49.5. Since the lowest test score is 54.5, this interval is used only to allow the graph to touch the x -axis. The point labeled 54.5 represents the next interval, or the first “real” interval from the table, and contains five scores. This reasoning is followed for each of the remaining intervals with the point 104.5 representing the interval from 99.5 to 109.5. Again, this interval contains no data and is only used so that the graph will touch the x -axis. Looking at the graph, we say that this distribution is skewed because one side of the graph does not mirror the other side.

Got questions? Get instant answers now!

Questions & Answers

what is phylogeny
Odigie Reply
evolutionary history and relationship of an organism or group of organisms
AI-Robot
ok
Deng
what is biology
Hajah Reply
the study of living organisms and their interactions with one another and their environments
AI-Robot
what is biology
Victoria Reply
HOW CAN MAN ORGAN FUNCTION
Alfred Reply
the diagram of the digestive system
Assiatu Reply
allimentary cannel
Ogenrwot
How does twins formed
William Reply
They formed in two ways first when one sperm and one egg are splited by mitosis or two sperm and two eggs join together
Oluwatobi
what is genetics
Josephine Reply
Genetics is the study of heredity
Misack
how does twins formed?
Misack
What is manual
Hassan Reply
discuss biological phenomenon and provide pieces of evidence to show that it was responsible for the formation of eukaryotic organelles
Joseph Reply
what is biology
Yousuf Reply
the study of living organisms and their interactions with one another and their environment.
Wine
discuss the biological phenomenon and provide pieces of evidence to show that it was responsible for the formation of eukaryotic organelles in an essay form
Joseph Reply
what is the blood cells
Shaker Reply
list any five characteristics of the blood cells
Shaker
lack electricity and its more savely than electronic microscope because its naturally by using of light
Abdullahi Reply
advantage of electronic microscope is easily and clearly while disadvantage is dangerous because its electronic. advantage of light microscope is savely and naturally by sun while disadvantage is not easily,means its not sharp and not clear
Abdullahi
cell theory state that every organisms composed of one or more cell,cell is the basic unit of life
Abdullahi
is like gone fail us
DENG
cells is the basic structure and functions of all living things
Ramadan
What is classification
ISCONT Reply
is organisms that are similar into groups called tara
Yamosa
in what situation (s) would be the use of a scanning electron microscope be ideal and why?
Kenna Reply
A scanning electron microscope (SEM) is ideal for situations requiring high-resolution imaging of surfaces. It is commonly used in materials science, biology, and geology to examine the topography and composition of samples at a nanoscale level. SEM is particularly useful for studying fine details,
Hilary
Got questions? Join the online conversation and get instant answers!
Jobilize.com Reply

Get Jobilize Job Search Mobile App in your pocket Now!

Get it on Google Play Download on the App Store Now


Source:  OpenStax, Introductory statistics. OpenStax CNX. May 06, 2016 Download for free at http://legacy.cnx.org/content/col11562/1.18
Google Play and the Google Play logo are trademarks of Google Inc.

Notification Switch

Would you like to follow the 'Introductory statistics' conversation and receive update notifications?

Ask