Fill in the blanks for the following sentence. Since the data consist of the numbers 1, 2, 3, and the starting point is 0.5, a width of one places the 1 in the middle of the interval 0.5 to _____, the 2 in the middle of the interval from _____ to _____, and the 3 in the middle of the interval from _____ to _____.
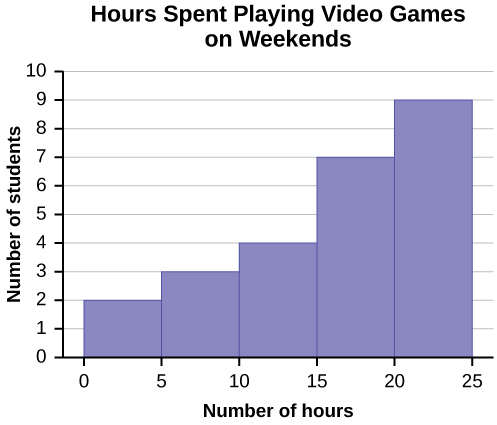
Number of Hours My Classmates Spent Playing Video Games on Weekends
9.95
10
2.25
16.75
0
19.5
22.5
7.5
15
12.75
5.5
11
10
20.75
17.5
23
21.9
24
23.75
18
20
15
22.9
18.8
20.5
Some values in this data set fall on boundaries for the class intervals. A value is counted in a class interval if it falls on the left boundary, but not if it falls on the right boundary. Different researchers may set up histograms for the same data in different ways. There is more than one correct way to set up a histogram.
Count the money (bills and change) in your pocket or purse. Your instructor will record the amounts. As a class, construct a histogram displaying the data. Discuss how many intervals you think is appropriate. You may want to experiment with the number of intervals.
Frequency polygons
Frequency polygons are analogous to line graphs, and just as line graphs make continuous data visually easy to interpret, so too do frequency polygons.
To construct a frequency polygon, first examine the data and decide on the number of intervals, or class intervals, to use on the
x -axis and
y -axis. After choosing the appropriate ranges, begin plotting the data points. After all the points are plotted, draw line segments to connect them.
A frequency polygon was constructed from the frequency table below.
Frequency Distribution for Calculus Final Test Scores
Lower Bound
Upper Bound
Frequency
Cumulative Frequency
49.5
59.5
5
5
59.5
69.5
10
15
69.5
79.5
30
45
79.5
89.5
40
85
89.5
99.5
15
100
The first label on the
x -axis is 44.5. This represents an interval extending from 39.5 to 49.5. Since the lowest test score is 54.5, this interval is used only to allow the graph to touch the
x -axis. The point labeled 54.5 represents the next interval, or the first “real” interval from the table, and contains five scores. This reasoning is followed for each of the remaining intervals with the point 104.5 representing the interval from 99.5 to 109.5. Again, this interval contains no data and is only used so that the graph will touch the
x -axis. Looking at the graph, we say that this distribution is skewed because one side of the graph does not mirror the other side.
The lymphatic system plays several crucial roles in the human body, functioning as a key component of the immune system and contributing to the maintenance of fluid balance. Its main functions include:
1. Immune Response: The lymphatic system produces and transports lymphocytes, which are a type of
asegid
to transport fluids fats proteins and lymphocytes to the blood stream as lymph
Anatomy is the study of the structure of the body, while physiology is the study of the function of the body. Anatomy looks at the body's organs and systems, while physiology looks at how those organs and systems work together to keep the body functioning.
Enzymes are proteins that help speed up chemical reactions in our bodies. Enzymes are essential for digestion, liver function and much more. Too much or too little of a certain enzyme can cause health problems
Kamara
yes
Prince
how does the stomach protect itself from the damaging effects of HCl
the normal temperature is 37°c or 98.6 °Fahrenheit is important for maintaining the homeostasis in the body
the body regular this temperature through the process called thermoregulation which involves brain skin muscle and other organ working together to maintain stable internal temperature