

| << Chapter < Page | Chapter >> Page > |
Go to [link] . There are calculator instructions for entering data and for creating a customized histogram. Create the histogram for [link] .
The following data are the number of sports played by 50 student athletes. The number of sports is discrete data since sports are counted.
1; 1; 1; 1; 1; 1; 1; 1; 1; 1; 1; 1; 1; 1; 1; 1; 1; 1; 1; 1
2; 2; 2; 2; 2; 2; 2; 2; 2; 2; 2; 2; 2; 2; 2; 2; 2; 2; 2; 2; 2; 2
3; 3; 3; 3; 3; 3; 3; 3
20 student athletes play one sport. 22 student athletes play two sports. Eight student athletes play three sports.
Fill in the blanks for the following sentence. Since the data consist of the numbers 1, 2, 3, and the starting point is 0.5, a width of one places the 1 in the middle of the interval 0.5 to _____, the 2 in the middle of the interval from _____ to _____, and the 3 in the middle of the interval from _____ to _____.
1.5
1.5 to 2.5
2.5 to 3.5
Using this data set, construct a histogram.
| Number of Hours My Classmates Spent Playing Video Games on Weekends | ||||
|---|---|---|---|---|
| 9.95 | 10 | 2.25 | 16.75 | 0 |
| 19.5 | 22.5 | 7.5 | 15 | 12.75 |
| 5.5 | 11 | 10 | 20.75 | 17.5 |
| 23 | 21.9 | 24 | 23.75 | 18 |
| 20 | 15 | 22.9 | 18.8 | 20.5 |
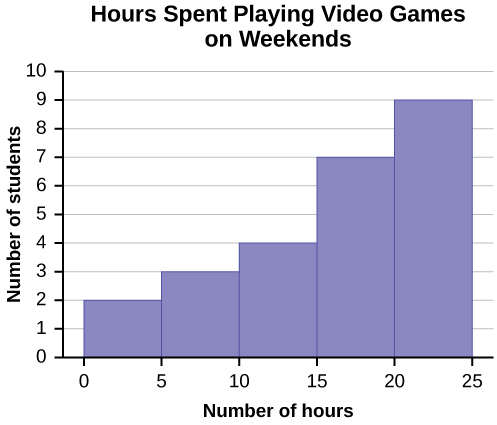
Some values in this data set fall on boundaries for the class intervals. A value is counted in a class interval if it falls on the left boundary, but not if it falls on the right boundary. Different researchers may set up histograms for the same data in different ways. There is more than one correct way to set up a histogram.
The following data represent the number of employees at various restaurants in New York City. Using this data, create a histogram.
Count the money (bills and change) in your pocket or purse. Your instructor will record the amounts. As a class, construct a histogram displaying the data. Discuss how many intervals you think is appropriate. You may want to experiment with the number of intervals.
Frequency polygons are analogous to line graphs, and just as line graphs make continuous data visually easy to interpret, so too do frequency polygons.
To construct a frequency polygon, first examine the data and decide on the number of intervals, or class intervals, to use on the x -axis and y -axis. After choosing the appropriate ranges, begin plotting the data points. After all the points are plotted, draw line segments to connect them.
A frequency polygon was constructed from the frequency table below.
| Frequency Distribution for Calculus Final Test Scores | |||
|---|---|---|---|
| Lower Bound | Upper Bound | Frequency | Cumulative Frequency |
| 49.5 | 59.5 | 5 | 5 |
| 59.5 | 69.5 | 10 | 15 |
| 69.5 | 79.5 | 30 | 45 |
| 79.5 | 89.5 | 40 | 85 |
| 89.5 | 99.5 | 15 | 100 |

The first label on the x -axis is 44.5. This represents an interval extending from 39.5 to 49.5. Since the lowest test score is 54.5, this interval is used only to allow the graph to touch the x -axis. The point labeled 54.5 represents the next interval, or the first “real” interval from the table, and contains five scores. This reasoning is followed for each of the remaining intervals with the point 104.5 representing the interval from 99.5 to 109.5. Again, this interval contains no data and is only used so that the graph will touch the x -axis. Looking at the graph, we say that this distribution is skewed because one side of the graph does not mirror the other side.
Notification Switch
Would you like to follow the 'Introductory statistics' conversation and receive update notifications?

|
|

|
|
|
|
|

|
|

|
|

|
|

|
|

|
|
|
|
|

|
|

|