<< Chapter < Page Chapter >> Page >

Try it

Suppose the time it takes a student to finish a quiz is uniformly distributed between six and 15 minutes, inclusive. Let X = the time, in minutes, it takes a student to finish a quiz. Then X ~ U (6, 15).

Find the probability that a randomly selected student needs at least eight minutes to complete the quiz. Then find the probability that a different student needs at least eight minutes to finish the quiz given that she has already taken more than seven minutes.

P ( x >8) = 0.7778

P ( x >8 | x>7) = 0.875

Got questions? Get instant answers now!

Ace Heating and Air Conditioning Service finds that the amount of time a repairman needs to fix a furnace is uniformly distributed between 1.5 and four hours. Let x = the time needed to fix a furnace. Then x ~ U (1.5, 4).

  1. Find the probability that a randomly selected furnace repair requires more than two hours.
  2. Find the probability that a randomly selected furnace repair requires less than three hours.
  3. Find the 30 th percentile of furnace repair times.
  4. The longest 25% of furnace repair times take at least how long? (In other words: find the minimum time for the longest 25% of repair times.) What percentile does this represent?
  5. Find the mean and standard deviation

e. μ = a + b 2 and σ = ( b a ) 2 12
μ 1.5 + 4 2 2.75 hours and σ = ( 4 1.5 ) 2 12 = 0.7217 hours

Got questions? Get instant answers now!

Try it

The amount of time a service technician needs to change the oil in a car is uniformly distributed between 11 and 21 minutes. Let X = the time needed to change the oil on a car.
  1. Write the random variable X in words. X = __________________.
  2. Write the distribution.
  3. Graph the distribution.
  4. Find P ( x >19).
  5. Find the 50 th percentile.
  1. Let X = the time needed to change the oil in a car.
  2. X ~ U (11, 21).
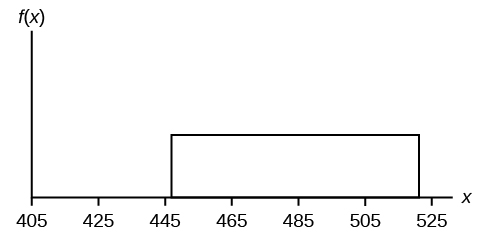
  3. This graph shows a uniform distribution. The horizontal axis ranges from 405 to 525. The distribution is modeled by a rectangle extending from x = 447 to x = 521.
  4. P ( x >19) = 0.2
  5. the 50 th percentile is 16 minutes.
Got questions? Get instant answers now!

Chapter review

If X has a uniform distribution where a < x < b or a x b , then X takes on values between a and b (may include a and b ). All values x are equally likely. We write X U ( a , b ). The mean of X is μ = a + b 2 . The standard deviation of X is σ = ( b a ) 2 12 . The probability density function of X is f ( x ) = 1 b a for a x b . The cumulative distribution function of X is P ( X x ) = x a b a . X is continuous.

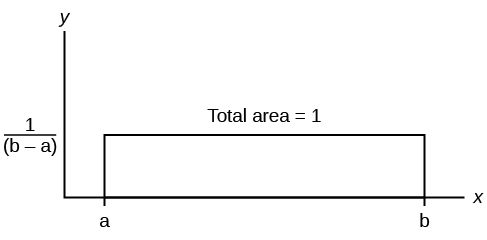
The graph shows a rectangle with total area equal to 1. The rectangle extends from x = a to x = b on the x-axis and has a height of 1/(b-a).

The probability P ( c < X < d ) may be found by computing the area under f ( x ), between c and d . Since the corresponding area is a rectangle, the area may be found simply by multiplying the width and the height.

Formula review

X = a real number between a and b (in some instances, X can take on the values a and b ). a = smallest X ; b = largest X

X ~ U (a, b)

The mean is μ = a + b 2

The standard deviation is σ = ( b  –  a ) 2 12

Probability density function: f ( x ) = 1 b a for a X b

Area to the Left of x : P ( X < x ) = ( x a ) ( 1 b a )

Area to the Right of x : P ( X > x ) = ( b x ) ( 1 b a )

Area Between c and d : P ( c < x < d ) = (base)(height) = ( d c ) ( 1 b a )

Uniform: X ~ U ( a , b ) where a < x < b

  • pdf: f ( x ) = 1 b a for a ≤ x ≤ b
  • cdf: P ( X x ) = x a b a
  • mean µ = a + b 2
  • standard deviation σ = ( b a ) 2 12
  • P ( c < X < d ) = ( d c ) ( 1 b a )

References

McDougall, John A. The McDougall Program for Maximum Weight Loss. Plume, 1995.

Use the following information to answer the next ten questions. The data that follow are the square footage (in 1,000 feet squared) of 28 homes.

1.5 2.4 3.6 2.6 1.6 2.4 2.0
3.5 2.5 1.8 2.4 2.5 3.5 4.0
2.6 1.6 2.2 1.8 3.8 2.5 1.5
2.8 1.8 4.5 1.9 1.9 3.1 1.6

The sample mean = 2.50 and the sample standard deviation = 0.8302.

The distribution can be written as X ~ U (1.5, 4.5).

What type of distribution is this?

Got questions? Get instant answers now!

In this distribution, outcomes are equally likely. What does this mean?

It means that the value of x is just as likely to be any number between 1.5 and 4.5.

Got questions? Get instant answers now!

What is the height of f ( x ) for the continuous probability distribution?

Got questions? Get instant answers now!

What are the constraints for the values of x ?

1.5 ≤ x ≤ 4.5

Got questions? Get instant answers now!

What is P (2< x <3)?

0.3333

Got questions? Get instant answers now!

What is P (x<3.5| x <4)?

Got questions? Get instant answers now!

What is P ( x = 1.5)?

zero

Got questions? Get instant answers now!

What is the 90 th percentile of square footage for homes?

Got questions? Get instant answers now!

Find the probability that a randomly selected home has more than 3,000 square feet given that you already know the house has more than 2,000 square feet.

0.6

Got questions? Get instant answers now!


Use the following information to answer the next eight exercises. A distribution is given as X ~ U (0, 12).

What is a ? What does it represent?

Got questions? Get instant answers now!

What is b ? What does it represent?

b is 12, and it represents the highest value of x .

Got questions? Get instant answers now!

What is the probability density function?

Got questions? Get instant answers now!

What is the theoretical mean?

six

Got questions? Get instant answers now!

What is the theoretical standard deviation?

Got questions? Get instant answers now!

Draw the graph of the distribution for P ( x >9).

This graph shows a uniform distribution. The horizontal axis ranges from 0 to 12. The distribution is modeled by a rectangle extending from x = 0 to x = 12. A region from x = 9 to x = 12 is shaded inside the rectangle.
Got questions? Get instant answers now!

Find the 40 th percentile.

4.8

Got questions? Get instant answers now!


Use the following information to answer the next eleven exercises. The age of cars in the staff parking lot of a suburban college is uniformly distributed from six months (0.5 years) to 9.5 years.

What is being measured here?

Got questions? Get instant answers now!

In words, define the random variable X .

X = The age (in years) of cars in the staff parking lot

Got questions? Get instant answers now!

Are the data discrete or continuous?

Got questions? Get instant answers now!

The interval of values for x is ______.

0.5 to 9.5

Got questions? Get instant answers now!

The distribution for X is ______.

Got questions? Get instant answers now!

Write the probability density function.

f ( x ) = 1 9 where x is between 0.5 and 9.5, inclusive.

Got questions? Get instant answers now!

Graph the probability distribution.

  1. Sketch the graph of the probability distribution.
    This is a blank graph template. The vertical and horizontal axes are unlabeled.
  2. Identify the following values:
    1. Lowest value for x ¯ : _______
    2. Highest value for x ¯ : _______
    3. Height of the rectangle: _______
    4. Label for x -axis (words): _______
    5. Label for y -axis (words): _______
Got questions? Get instant answers now!

Find the average age of the cars in the lot.

μ = 5

Got questions? Get instant answers now!

Find the probability that a randomly chosen car in the lot was less than four years old.

  1. Sketch the graph, and shade the area of interest.
    Blank graph with vertical and horizontal axes.
  2. Find the probability. P ( x <4) = _______
Got questions? Get instant answers now!

Considering only the cars less than 7.5 years old, find the probability that a randomly chosen car in the lot was less than four years old.

  1. Sketch the graph, shade the area of interest.
    This is a blank graph template. The vertical and horizontal axes are unlabeled.
  2. Find the probability. P ( x <4| x <7.5) = _______
  1. Check student’s solution.
  2. 3.5 7
Got questions? Get instant answers now!

What has changed in the previous two problems that made the solutions different?

Got questions? Get instant answers now!

Find the third quartile of ages of cars in the lot. This means you will have to find the value such that 3 4 , or 75%, of the cars are at most (less than or equal to) that age.

  1. Sketch the graph, and shade the area of interest.
    Blank graph with vertical and horizontal axes.
  2. Find the value k such that P ( x < k ) = 0.75.
  3. The third quartile is _______
  1. Check student's solution.
  2. k = 7.25
  3. 7.25
Got questions? Get instant answers now!

Questions & Answers

what is phylogeny
Odigie Reply
evolutionary history and relationship of an organism or group of organisms
AI-Robot
ok
Deng
what is biology
Hajah Reply
the study of living organisms and their interactions with one another and their environments
AI-Robot
what is biology
Victoria Reply
HOW CAN MAN ORGAN FUNCTION
Alfred Reply
the diagram of the digestive system
Assiatu Reply
allimentary cannel
Ogenrwot
How does twins formed
William Reply
They formed in two ways first when one sperm and one egg are splited by mitosis or two sperm and two eggs join together
Oluwatobi
what is genetics
Josephine Reply
Genetics is the study of heredity
Misack
how does twins formed?
Misack
What is manual
Hassan Reply
discuss biological phenomenon and provide pieces of evidence to show that it was responsible for the formation of eukaryotic organelles
Joseph Reply
what is biology
Yousuf Reply
the study of living organisms and their interactions with one another and their environment.
Wine
discuss the biological phenomenon and provide pieces of evidence to show that it was responsible for the formation of eukaryotic organelles in an essay form
Joseph Reply
what is the blood cells
Shaker Reply
list any five characteristics of the blood cells
Shaker
lack electricity and its more savely than electronic microscope because its naturally by using of light
Abdullahi Reply
advantage of electronic microscope is easily and clearly while disadvantage is dangerous because its electronic. advantage of light microscope is savely and naturally by sun while disadvantage is not easily,means its not sharp and not clear
Abdullahi
cell theory state that every organisms composed of one or more cell,cell is the basic unit of life
Abdullahi
is like gone fail us
DENG
cells is the basic structure and functions of all living things
Ramadan
What is classification
ISCONT Reply
is organisms that are similar into groups called tara
Yamosa
in what situation (s) would be the use of a scanning electron microscope be ideal and why?
Kenna Reply
A scanning electron microscope (SEM) is ideal for situations requiring high-resolution imaging of surfaces. It is commonly used in materials science, biology, and geology to examine the topography and composition of samples at a nanoscale level. SEM is particularly useful for studying fine details,
Hilary
Got questions? Join the online conversation and get instant answers!
Jobilize.com Reply

Get Jobilize Job Search Mobile App in your pocket Now!

Get it on Google Play Download on the App Store Now


Source:  OpenStax, Introductory statistics. OpenStax CNX. May 06, 2016 Download for free at http://legacy.cnx.org/content/col11562/1.18
Google Play and the Google Play logo are trademarks of Google Inc.

Notification Switch

Would you like to follow the 'Introductory statistics' conversation and receive update notifications?

Ask