<< Chapter < Page Chapter >> Page >

Because r is significant and the scatter plot shows a linear trend, the regression line can be used to predict final exam scores.

Suppose you computed the following correlation coefficients. Using the table at the end of the chapter, determine if r is significant and the line of best fit associated with each r can be used to predict a y value. If it helps, draw a number line.

  1. r = –0.567 and the sample size, n , is 19. The df = n – 2 = 17. The critical value is –0.456. –0.567<–0.456 so r is significant.
  2. r = 0.708 and the sample size, n , is nine. The df = n – 2 = 7. The critical value is 0.666. 0.708>0.666 so r is significant.
  3. r = 0.134 and the sample size, n , is 14. The df = 14 – 2 = 12. The critical value is 0.532. 0.134 is between –0.532 and 0.532 so r is not significant.
  4. r = 0 and the sample size, n , is five. No matter what the dfs are, r = 0 is between the two critical values so r is not significant.
Got questions? Get instant answers now!

Try it

For a given line of best fit, you compute that r = 0 using n = 100 data points. Can the line be used for prediction? Why or why not?

No, the line cannot be used for prediction no matter what the sample size is.

Got questions? Get instant answers now!

Assumptions in testing the significance of the correlation coefficient

Testing the significance of the correlation coefficient requires that certain assumptions about the data are satisfied. The premise of this test is that the data are a sample of observed points taken from a larger population. We have not examined the entire population because it is not possible or feasible to do so. We are examining the sample to draw a conclusion about whether the linear relationship that we see between x and y in the sample data provides strong enough evidence so that we can conclude that there is a linear relationship between x and y in the population.

The regression line equation that we calculate from the sample data gives the best-fit line for our particular sample. We want to use this best-fit line for the sample as an estimate of the best-fit line for the population. Examining the scatterplot and testing the significance of the correlation coefficient helps us determine if it is appropriate to do this.

    The assumptions underlying the test of significance are:

  • There is a linear relationship in the population that models the average value of y for varying values of x . In other words, the expected value of y for each particular value lies on a straight line in the population. (We do not know the equation for the line for the population. Our regression line from the sample is our best estimate of this line in the population.)
  • The y values for any particular x value are normally distributed about the line. This implies that there are more y values scattered closer to the line than are scattered farther away. Assumption (1) implies that these normal distributions are centered on the line: the means of these normal distributions of y values lie on the line.
  • The standard deviations of the population y values about the line are equal for each value of x . In other words, each of these normal distributions of y values has the same shape and spread about the line.
  • The residual errors are mutually independent (no pattern).
  • The data are produced from a well-designed, random sample or randomized experiment.
The left graph shows three sets of points. Each set falls in a vertical line. The points in each set are normally distributed along the line — they are densely packed in the middle and more spread out at the top and bottom. A downward sloping regression line passes through the mean of each set. The right graph shows the same regression line plotted. A vertical normal curve is shown for each line.
The y values for each x value are normally distributed about the line with the same standard deviation. For each x value, the mean of the y values lies on the regression line. More y values lie near the line than are scattered further away from the line.

Chapter review

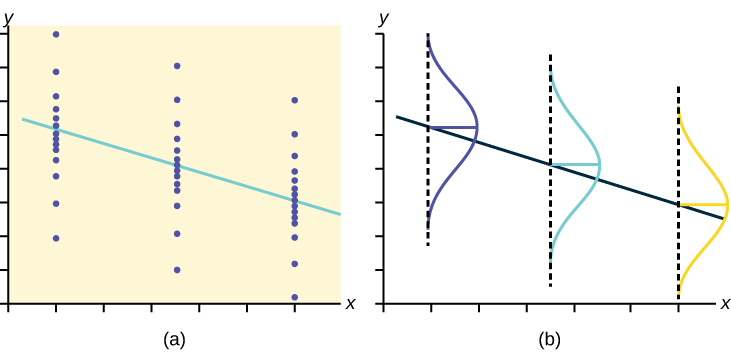
Linear regression is a procedure for fitting a straight line of the form ŷ = a + bx to data. The conditions for regression are:

  • Linear In the population, there is a linear relationship that models the average value of y for different values of x .
  • Independent The residuals are assumed to be independent.
  • Normal The y values are distributed normally for any value of x .
  • Equal variance The standard deviation of the y values is equal for each x value.
  • Random The data are produced from a well-designed random sample or randomized experiment.

The slope b and intercept a of the least-squares line estimate the slope β and intercept α of the population (true) regression line. To estimate the population standard deviation of y , σ , use the standard deviation of the residuals, s . s = S E E n 2 . The variable ρ (rho) is the population correlation coefficient. To test the null hypothesis H 0 : ρ = hypothesized value , use a linear regression t-test. The most common null hypothesis is H 0 : ρ = 0 which indicates there is no linear relationship between x and y in the population. The TI-83, 83+, 84, 84+ calculator function LinRegTTest can perform this test (STATS TESTS LinRegTTest).

Formula review

Least Squares Line or Line of Best Fit:

y ^ = a + b x

where

a = y -intercept

b = slope

Standard deviation of the residuals:

s = S E E n 2 .

where

SSE = sum of squared errors

n = the number of data points

When testing the significance of the correlation coefficient, what is the null hypothesis?

Got questions? Get instant answers now!

When testing the significance of the correlation coefficient, what is the alternative hypothesis?

H a : ρ ≠ 0

Got questions? Get instant answers now!

If the level of significance is 0.05 and the p -value is 0.04, what conclusion can you draw?

Got questions? Get instant answers now!

Questions & Answers

Discuss the differences between taste and flavor, including how other sensory inputs contribute to our  perception of flavor.
John Reply
taste refers to your understanding of the flavor . while flavor one The other hand is refers to sort of just a blend things.
Faith
While taste primarily relies on our taste buds, flavor involves a complex interplay between taste and aroma
Kamara
which drugs can we use for ulcers
Ummi Reply
omeprazole
Kamara
what
Renee
what is this
Renee
is a drug
Kamara
of anti-ulcer
Kamara
Omeprazole Cimetidine / Tagament For the complicated once ulcer - kit
Patrick
what is the function of lymphatic system
Nency Reply
Not really sure
Eli
to drain extracellular fluid all over the body.
asegid
The lymphatic system plays several crucial roles in the human body, functioning as a key component of the immune system and contributing to the maintenance of fluid balance. Its main functions include: 1. Immune Response: The lymphatic system produces and transports lymphocytes, which are a type of
asegid
to transport fluids fats proteins and lymphocytes to the blood stream as lymph
Adama
what is anatomy
Oyindarmola Reply
Anatomy is the identification and description of the structures of living things
Kamara
what's the difference between anatomy and physiology
Oyerinde Reply
Anatomy is the study of the structure of the body, while physiology is the study of the function of the body. Anatomy looks at the body's organs and systems, while physiology looks at how those organs and systems work together to keep the body functioning.
AI-Robot
what is enzymes all about?
Mohammed Reply
Enzymes are proteins that help speed up chemical reactions in our bodies. Enzymes are essential for digestion, liver function and much more. Too much or too little of a certain enzyme can cause health problems
Kamara
yes
Prince
how does the stomach protect itself from the damaging effects of HCl
Wulku Reply
little girl okay how does the stomach protect itself from the damaging effect of HCL
Wulku
it is because of the enzyme that the stomach produce that help the stomach from the damaging effect of HCL
Kamara
function of digestive system
Ali Reply
function of digestive
Ali
the diagram of the lungs
Adaeze Reply
what is the normal body temperature
Diya Reply
37 degrees selcius
Xolo
37°c
Stephanie
please why 37 degree selcius normal temperature
Mark
36.5
Simon
37°c
Iyogho
the normal temperature is 37°c or 98.6 °Fahrenheit is important for maintaining the homeostasis in the body the body regular this temperature through the process called thermoregulation which involves brain skin muscle and other organ working together to maintain stable internal temperature
Stephanie
37A c
Wulku
what is anaemia
Diya Reply
anaemia is the decrease in RBC count hemoglobin count and PVC count
Eniola
what is the pH of the vagina
Diya Reply
how does Lysin attack pathogens
Diya
acid
Mary
I information on anatomy position and digestive system and there enzyme
Elisha Reply
anatomy of the female external genitalia
Muhammad Reply
Organ Systems Of The Human Body (Continued) Organ Systems Of The Human Body (Continued)
Theophilus Reply
what's lochia albra
Kizito
Got questions? Join the online conversation and get instant answers!
Jobilize.com Reply

Get Jobilize Job Search Mobile App in your pocket Now!

Get it on Google Play Download on the App Store Now


Source:  OpenStax, Introductory statistics. OpenStax CNX. May 06, 2016 Download for free at http://legacy.cnx.org/content/col11562/1.18
Google Play and the Google Play logo are trademarks of Google Inc.

Notification Switch

Would you like to follow the 'Introductory statistics' conversation and receive update notifications?

Ask