

| << Chapter < Page | Chapter >> Page > |
A new prep class was designed to improve SAT test scores. Five students were selected at random. Their scores on two practice exams were recorded, one before the class and one after. The data recorded in [link] . Are the scores, on average, higher after the class? Test at a 5% level.
| SAT Scores | Student 1 | Student 2 | Student 3 | Student 4 |
|---|---|---|---|---|
| Score before class | 1840 | 1960 | 1920 | 2150 |
| Score after class | 1920 | 2160 | 2200 | 2100 |
The p -value is 0.0874, so we decline to reject the null hypothesis. The data do not support that the class improves SAT scores significantly.
Seven eighth graders at Kennedy Middle School measured how far they could push the shot-put with their dominant (writing) hand and their weaker (non-writing) hand. They thought that they could push equal distances with either hand. The data were collected and recorded in [link] .
| Distance (in feet) using | Student 1 | Student 2 | Student 3 | Student 4 | Student 5 | Student 6 | Student 7 |
|---|---|---|---|---|---|---|---|
| Dominant Hand | 30 | 26 | 34 | 17 | 19 | 26 | 20 |
| Weaker Hand | 28 | 14 | 27 | 18 | 17 | 26 | 16 |
Conduct a hypothesis test to determine whether the mean difference in distances between the children’s dominant versus weaker hands is significant.
Record the differences data. Calculate the differences by subtracting the distances with the weaker hand from the distances with the dominant hand. The data for the differences are: {2, 12, 7, –1, 2, 0, 4}. The differences have a normal distribution.
Using the differences data, calculate the sample mean and the sample standard deviation. = 3.71, = 4.5.
Random variable: = mean difference in the distances between the hands.
Distribution for the hypothesis test: t 6
H 0 : μ d = 0 H a : μ d ≠ 0
Graph:
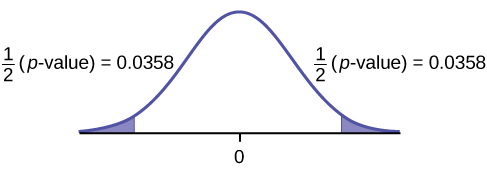
Calculate the p -value: The p -value is 0.0716 (using the data directly).
(test statistic = 2.18. p -value = 0.0719 using
Decision: Assume α = 0.05. Since α < p -value, Do not reject H 0 .
Conclusion: At the 5% level of significance, from the sample data, there is not sufficient evidence to conclude that there is a difference in the children’s weaker and dominant hands to push the shot-put.
Five ball players think they can throw the same distance with their dominant hand (throwing) and off-hand (catching hand). The data were collected and recorded in [link] . Conduct a hypothesis test to determine whether the mean difference in distances between the dominant and off-hand is significant. Test at the 5% level.
| Player 1 | Player 2 | Player 3 | Player 4 | Player 5 | |
|---|---|---|---|---|---|
| Dominant Hand | 120 | 111 | 135 | 140 | 125 |
| Off-hand | 105 | 109 | 98 | 111 | 99 |
The p -level is 0.0230, so we can reject the null hypothesis. The data show that the players do not throw the same distance with their off-hands as they do with their dominant hands.
A hypothesis test for matched or paired samples (t-test) has these characteristics:
Notification Switch
Would you like to follow the 'Introductory statistics' conversation and receive update notifications?

|
|

|
|

|
|

|
|

|
|

|
|

|
|

|
|

|
|

|
|

|