

| << Chapter < Page | Chapter >> Page > |
130. Out of the years with water rationing, find the probability that there is a drought.
Use the following information to answer the next three exercises:
| Apple | Pumpkin | Pecan | |
|---|---|---|---|
| Female | 40 | 10 | 30 |
| Male | 20 | 30 | 10 |
131. Suppose that one individual is randomly chosen. Find the probability that the person’s favorite pie is apple or the person is male.
132. Suppose that one male is randomly chosen. Find the probability his favorite pie is pecan.
133. Conduct a hypothesis test to determine if favorite pie type and gender are independent.
Use the following information to answer the next two exercises: Let’s say that the probability that an adult watches the news at least once per week is 0.60.
134. We randomly survey 14 people. On average, how many people do we expect to watch the news at least once per week?
135. We randomly survey 14 people. Of interest is the number that watch the news at least once per week. State the distribution of X . X ~ _____
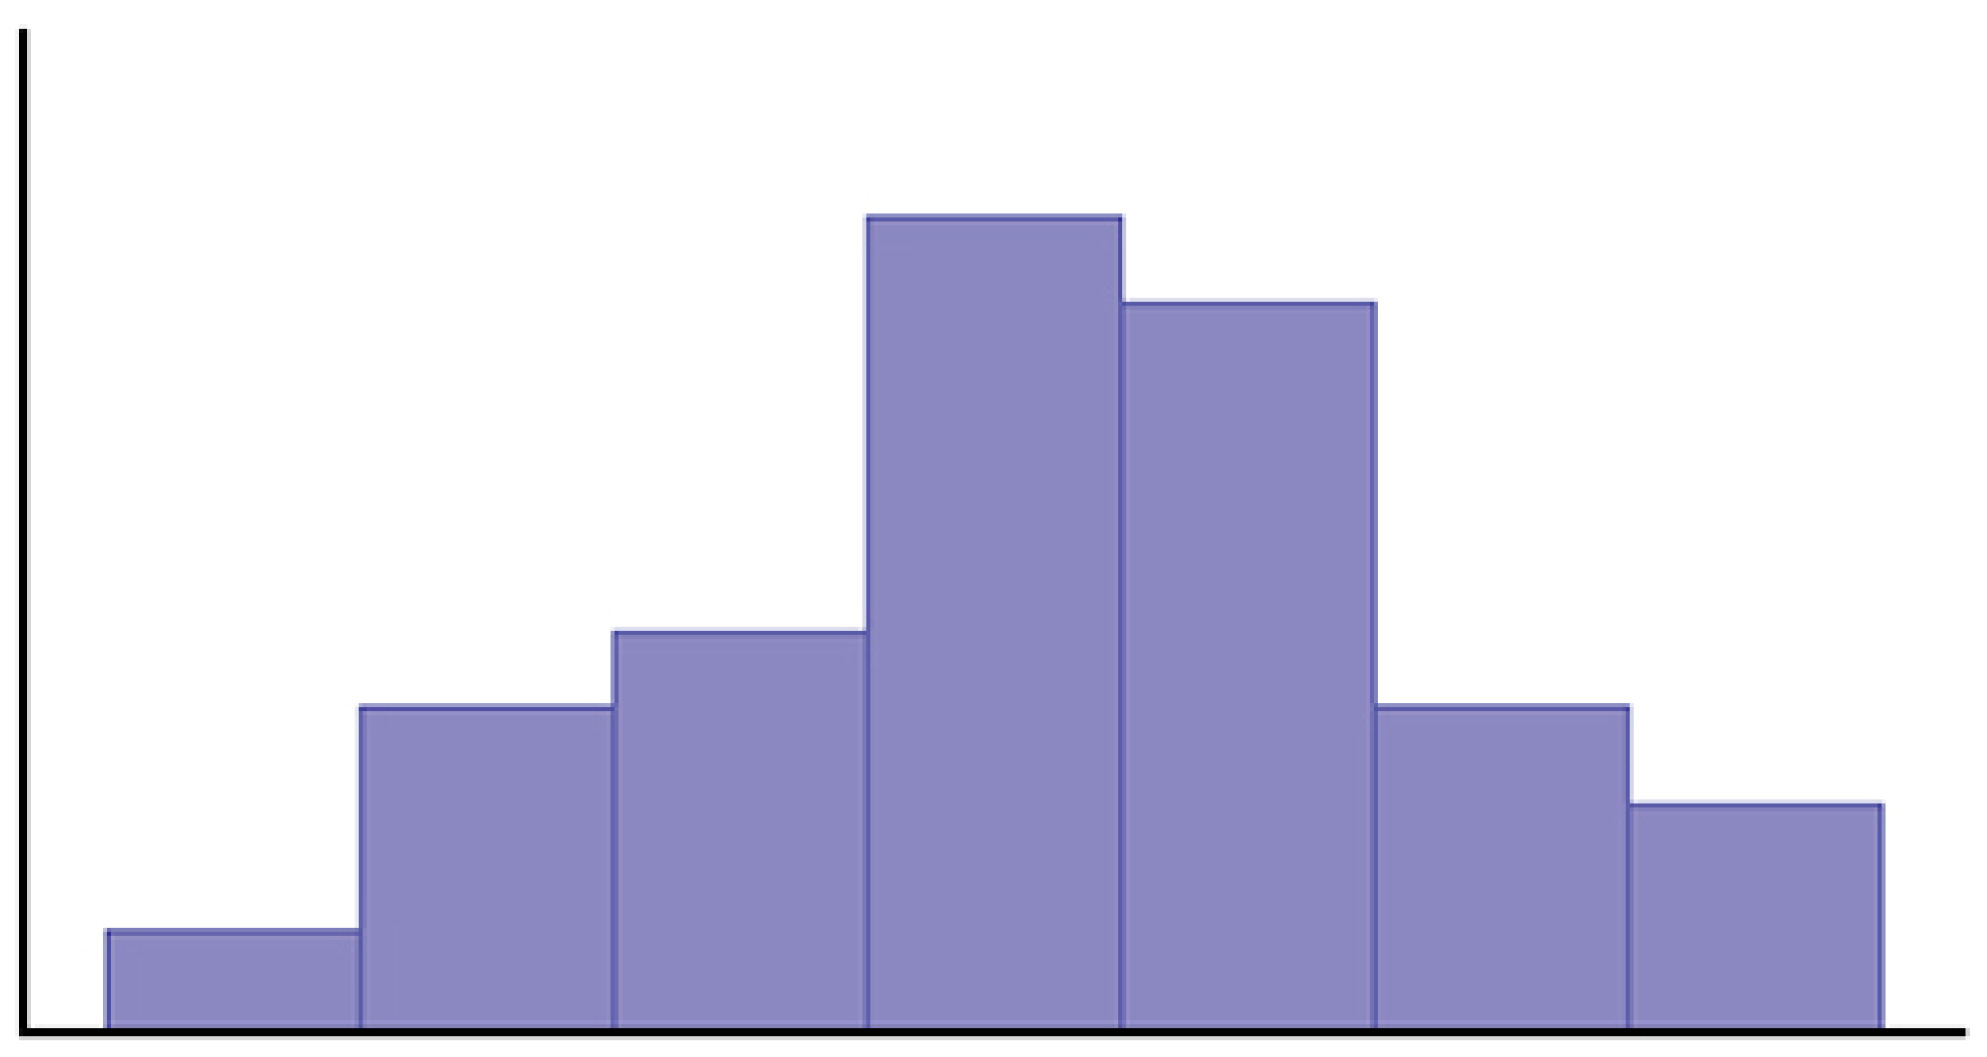
136. The following histogram is most likely to be a result of sampling from which distribution?
137. The ages of De Anza evening students is known to be normally distributed with a population mean of 40 and a population standard deviation of six. A sample of six De Anza evening students reported their ages (in years) as: 28; 35; 47; 45; 30; 50. Find the probability that the mean of six ages of randomly chosen students is less than 35 years. Hint: Find the sample mean.
138. A math exam was given to all the fifth grade children attending Country School. Two random samples of scores were taken. The null hypothesis is that the mean math scores for boys and girls in fifth grade are the same. Conduct a hypothesis test.
| n | s 2 | ||
|---|---|---|---|
| Boys | 55 | 82 | 29 |
| Girls | 60 | 86 | 46 |
139. In a survey of 80 males, 55 had played an organized sport growing up. Of the 70 females surveyed, 25 had played an organized sport growing up. We are interested in whether the proportion for males is higher than the proportion for females. Conduct a hypothesis test.
140. Which of the following is preferable when designing a hypothesis test?
Use the following information to answer the next three exercises: 120 people were surveyed as to their favorite beverage (non-alcoholic). The results are below.
| Beverage/Age | 0–9 | 10–19 | 20–29 | 30+ | Totals |
|---|---|---|---|---|---|
| Milk | 14 | 10 | 6 | 0 | 30 |
| Soda | 3 | 8 | 26 | 15 | 52 |
| Juice | 7 | 12 | 12 | 7 | 38 |
| Totals | 24 | 330 | 44 | 22 | 120 |
141. Are the events of milk and 30+:
142. Suppose that one person is randomly chosen. Find the probability that person is 10–19 given that he or she prefers juice.
143. Are “Preferred Beverage” and “Age” independent events? Conduct a hypothesis test.
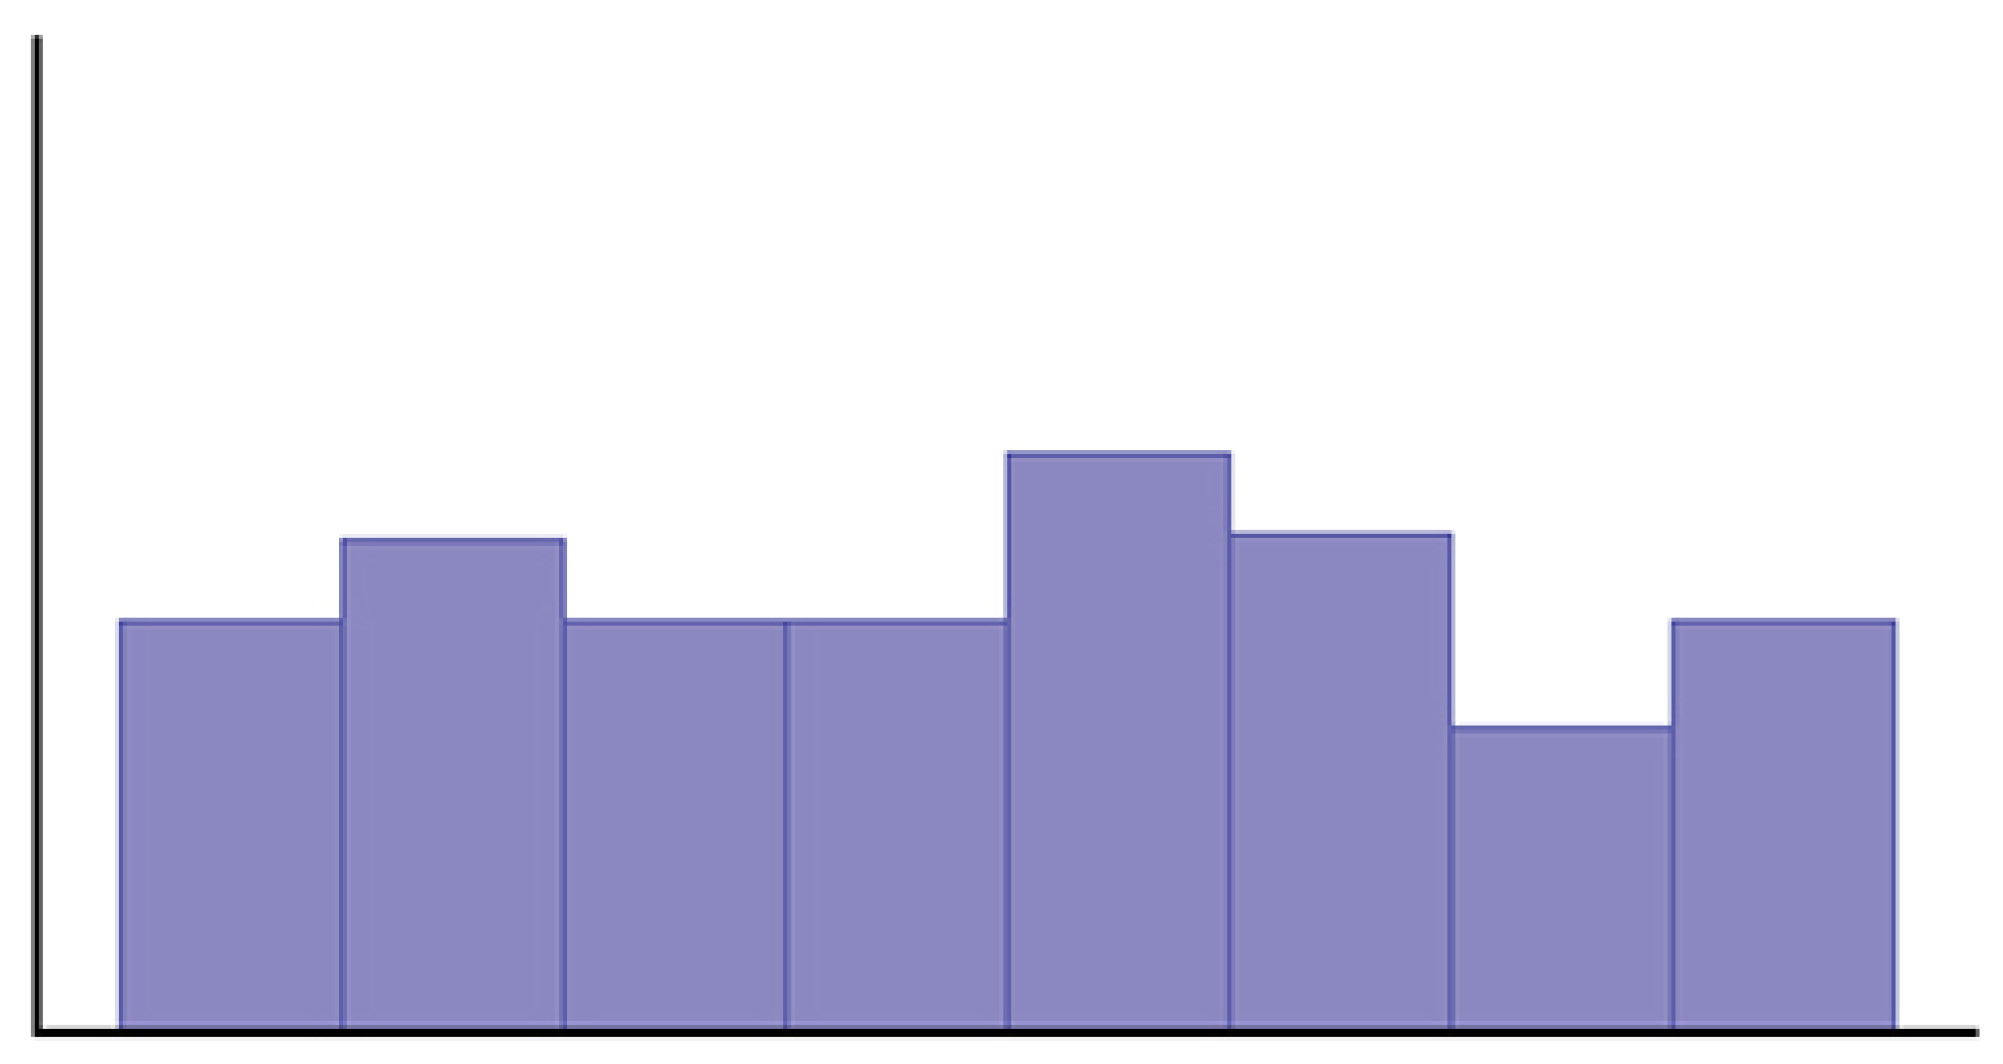
144. Given the following histogram, which distribution is the data most likely to come from?
1. c. parameter
2. a. population
3. b. statistic
4. d. sample
5. e. variable
6. quantitative continuous
7.
8. Answers will vary.
9. c. (0.80)(0.30)
10. b. No, and they are not mutually exclusive either.
Notification Switch
Would you like to follow the 'Introductory statistics' conversation and receive update notifications?

|
|
|
|
|

|
|

|
|

|
|

|
|

|
|

|
|
|
|
|

|
|
|
|
|

|