| << Chapter < Page | Chapter >> Page > |
Test Statistic ( t -score): t =
where:
is the mean of the sample differences. μ d is the mean of the population differences. s d is the sample standard deviation of the differences. n is the sample size.
Use the following information to answer the next five exercises. A study was conducted to test the effectiveness of a software patch in reducing system failures over a six-month period. Results for randomly selected installations are shown in [link] . The “before” value is matched to an “after” value, and the differences are calculated. The differences have a normal distribution. Test at the 1% significance level.
| Installation | A | B | C | D | E | F | G | H |
|---|---|---|---|---|---|---|---|---|
| Before | 3 | 6 | 4 | 2 | 5 | 8 | 2 | 6 |
| After | 1 | 5 | 2 | 0 | 1 | 0 | 2 | 2 |
What is the random variable?
the mean difference of the system failures
State the null and alternative hypotheses.
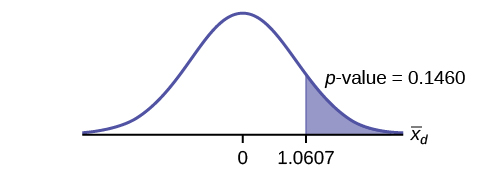
Draw the graph of the p -value.
What conclusion can you draw about the software patch?
With a p -value 0.0067, we can reject the null hypothesis. There is enough evidence to support that the software patch is effective in reducing the number of system failures.
Use the following information to answer next five exercises. A study was conducted to test the effectiveness of a juggling class. Before the class started, six subjects juggled as many balls as they could at once. After the class, the same six subjects juggled as many balls as they could. The differences in the number of balls are calculated. The differences have a normal distribution. Test at the 1% significance level.
| Subject | A | B | C | D | E | F |
|---|---|---|---|---|---|---|
| Before | 3 | 4 | 3 | 2 | 4 | 5 |
| After | 4 | 5 | 6 | 4 | 5 | 7 |
State the null and alternative hypotheses.
What is the sample mean difference?
What conclusion can you draw about the juggling class?
Use the following information to answer the next five exercises. A doctor wants to know if a blood pressure medication is effective. Six subjects have their blood pressures recorded. After twelve weeks on the medication, the same six subjects have their blood pressure recorded again. For this test, only systolic pressure is of concern. Test at the 1% significance level.
| Patient | A | B | C | D | E | F |
|---|---|---|---|---|---|---|
| Before | 161 | 162 | 165 | 162 | 166 | 171 |
| After | 158 | 159 | 166 | 160 | 167 | 169 |
State the null and alternative hypotheses.
H 0 : μ d ≥ 0
H a : μ d <0
What is the test statistic?
What is the sample mean difference?
What is the conclusion?
We decline to reject the null hypothesis. There is not sufficient evidence to support that the medication is effective.
Use the following information to answer the next ten exercises. indicate which of the following choices best identifies the hypothesis test.
A powder diet is tested on 49 people, and a liquid diet is tested on 36 different people. The population standard deviations are two pounds and three pounds, respectively. Of interest is whether the liquid diet yields a higher mean weight loss than the powder diet.
Notification Switch
Would you like to follow the 'Introductory statistics' conversation and receive update notifications?

|
|

|
|

|
|

|
|

|
|

|
|

|
|

|
|

|
|

|
|

|