

| << Chapter < Page | Chapter >> Page > |
33 . What is SS within in this experiment, and what does it mean?
34 . What is SS between in this experiment, and what does it mean?
35 . What are k and i for this experiment?
36 . If SS within = 374.5 and SS total = 621.4 for this data, what is SS between ?
37 . What are MS between , and MS within , for this experiment?
38 . What is the F Statistic for this data?
39 . If there had been 35 calves in each group, instead of 30, with the sums of squares remaining the same, would the F Statistic be larger or smaller?
40 . Which of the following numbers are possible F Statistics?
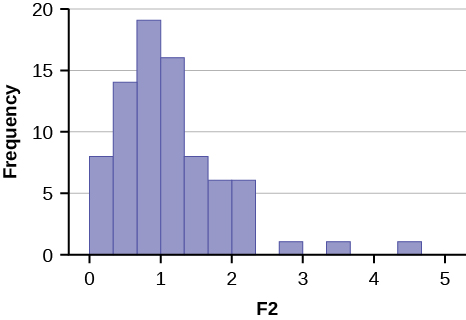
41 . Histograms F 1 and F 2 below display the distribution of cases from samples from two populations, one distributed F 3,15 and one distributed F 5,500 . Which sample came from which population?

42 . The F Statistic from an experiment with k = 3 and n = 50 is 3.67. At α = 0.05, will you reject the null hypothesis?
43 . The F Statistic from an experiment with k = 4 and n = 100 is 4.72. At α = 0.01, will you reject the null hypothesis?
44 . What assumptions must be met to perform the F test of two variances?
45 . You believe there is greater variance in grades given by the math department at your university than in the English department. You collect all the grades for undergraduate classes in the two departments for a semester, and compute the variance of each, and conduct an F test of two variances. What are the null and alternative hypotheses for this study?
1 . e. A, B, and C.
All three are linear equations of the form
y =
mx +
b .
2 . Let y = the total number of hours required, and x the square footage, measured in units of 1,000. The equation is: y = x + 4
3 . Let y = the total payment, and x the number of students in a class. The equation is: y = 100( x ) + 2,000
4 . Let y = the total cost of attendance, and x the number of years enrolled. The equation is: y = 3,000( x ) + 500
5 . The independent variable is the hours worked on a car. The dependent variable is the total labor charges to fix a car.
6 . Let
y = the total charge, and
x the number of hours required. The equation is:
y = 55
x + 75
The slope is 55 and the intercept is 75.
7 . y = 55(3.5) + 75 = 267.50
8 . Because the intercept is included in both equations, while you are only interested in the difference in costs, you do not need to include the intercept in the solution. The difference in number of hours required is: 6.3 – 2.4 = 3.9.
Multiply this difference by the cost per hour: 55(3.9) = 214.5.
The difference in cost between the two jobs is $214.50.
9 . The X and Y variables have a strong linear relationship. These variables would be good candidates for analysis with linear regression.
10 . The X and Y variables have a strong negative linear relationship. These variables would be good candidates for analysis with linear regression.
11 . There is no clear linear relationship between the X and Y variables, so they are not good candidates for linear regression.
12 . The X and Y variables have a strong positive relationship, but it is curvilinear rather than linear. These variables are not good candidates for linear regression.
Notification Switch
Would you like to follow the 'Introductory statistics' conversation and receive update notifications?

|
|
|
|
|

|
|

|
|

|
|

|
|

|
|

|
|

|
|

|
|

|
|

|