<< Chapter < Page Chapter >> Page >
This photo shows many different pairs of shoes in various colors. The shoes appear to be hanging from a wall by cords.
If you ask enough people about their shoe size, you will find that your graphed data is shaped like a bell curve and can be described as normally distributed. (credit: Ömer Ünlϋ)

Chapter objectives

By the end of this chapter, the student should be able to:

  • Recognize the normal probability distribution and apply it appropriately.
  • Recognize the standard normal probability distribution and apply it appropriately.
  • Compare normal probabilities by converting to the standard normal distribution.

The normal, a continuous distribution, is the most important of all the distributions. It is widely used and even more widely abused. Its graph is bell-shaped. You see the bell curve in almost all disciplines. Some of these include psychology, business, economics, the sciences, nursing, and, of course, mathematics. Some of your instructors may use the normal distribution to help determine your grade. Most IQ scores are normally distributed. Often real-estate prices fit a normal distribution. The normal distribution is extremely important, but it cannot be applied to everything in the real world.

In this chapter, you will study the normal distribution, the standard normal distribution, and applications associated with them.

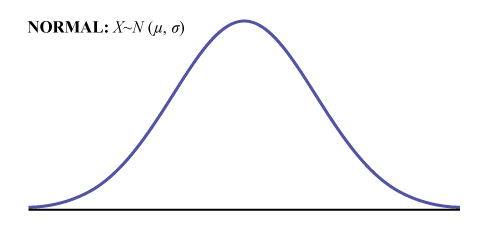
The normal distribution has two parameters (two numerical descriptive measures), the mean ( μ ) and the standard deviation ( σ ). If X is a quantity to be measured that has a normal distribution with mean ( μ ) and standard deviation ( σ ), we designate this by writing

This is a frequency curve for a normal distribution. It shows a single peak in the center with the curve tapering down to the horizontal axis on each side. The distribution is symmetrical; it represents the random variable X having a normal distribution with a mean, m, and standard deviation, s.

The probability density function is a rather complicated function. Do not memorize it . It is not necessary.

f ( x ) = 1 σ 2 π    e 1 2 ( x μ σ ) 2

The cumulative distribution function is P ( X < x ). It is calculated either by a calculator or a computer, or it is looked up in a table. Technology has made the tables virtually obsolete. For that reason, as well as the fact that there are various table formats, we are not including table instructions.

The curve is symmetrical about a vertical line drawn through the mean, μ . In theory, the mean is the same as the median, because the graph is symmetric about μ . As the notation indicates, the normal distribution depends only on the mean and the standard deviation. Since the area under the curve must equal one, a change in the standard deviation, σ , causes a change in the shape of the curve; the curve becomes fatter or skinnier depending on σ . A change in μ causes the graph to shift to the left or right. This means there are an infinite number of normal probability distributions. One of special interest is called the standard normal distribution .

Collaborative classroom activity

Your instructor will record the heights of both men and women in your class, separately. Draw histograms of your data. Then draw a smooth curve through each histogram. Is each curve somewhat bell-shaped? Do you think that if you had recorded 200 data values for men and 200 for women that the curves would look bell-shaped? Calculate the mean for each data set. Write the means on the x -axis of the appropriate graph below the peak. Shade the approximate area that represents the probability that one randomly chosen male is taller than 72 inches. Shade the approximate area that represents the probability that one randomly chosen female is shorter than 60 inches. If the total area under each curve is one, does either probability appear to be more than 0.5?

Formula review

X N ( μ , σ )

  • μ = the mean
  • σ = the standard deviation

Questions & Answers

Ayele, K., 2003. Introductory Economics, 3rd ed., Addis Ababa.
Widad Reply
can you send the book attached ?
Ariel
?
Ariel
What is economics
Widad Reply
the study of how humans make choices under conditions of scarcity
AI-Robot
U(x,y) = (x×y)1/2 find mu of x for y
Desalegn Reply
U(x,y) = (x×y)1/2 find mu of x for y
Desalegn
what is ecnomics
Jan Reply
this is the study of how the society manages it's scarce resources
Belonwu
what is macroeconomic
John Reply
macroeconomic is the branch of economics which studies actions, scale, activities and behaviour of the aggregate economy as a whole.
husaini
etc
husaini
difference between firm and industry
husaini Reply
what's the difference between a firm and an industry
Abdul
firm is the unit which transform inputs to output where as industry contain combination of firms with similar production 😅😅
Abdulraufu
Suppose the demand function that a firm faces shifted from Qd  120 3P to Qd  90  3P and the supply function has shifted from QS  20  2P to QS 10  2P . a) Find the effect of this change on price and quantity. b) Which of the changes in demand and supply is higher?
Toofiq Reply
explain standard reason why economic is a science
innocent Reply
factors influencing supply
Petrus Reply
what is economic.
Milan Reply
scares means__________________ends resources. unlimited
Jan
economics is a science that studies human behaviour as a relationship b/w ends and scares means which have alternative uses
Jan
calculate the profit maximizing for demand and supply
Zarshad Reply
Why qualify 28 supplies
Milan
what are explicit costs
Nomsa Reply
out-of-pocket costs for a firm, for example, payments for wages and salaries, rent, or materials
AI-Robot
concepts of supply in microeconomics
David Reply
economic overview notes
Amahle Reply
identify a demand and a supply curve
Salome Reply
i don't know
Parul
there's a difference
Aryan
Demand curve shows that how supply and others conditions affect on demand of a particular thing and what percent demand increase whith increase of supply of goods
Israr
Hi Sir please how do u calculate Cross elastic demand and income elastic demand?
Abari
Got questions? Join the online conversation and get instant answers!
Jobilize.com Reply
Practice Key Terms 1

Get Jobilize Job Search Mobile App in your pocket Now!

Get it on Google Play Download on the App Store Now


Source:  OpenStax, Introductory statistics. OpenStax CNX. May 06, 2016 Download for free at http://legacy.cnx.org/content/col11562/1.18
Google Play and the Google Play logo are trademarks of Google Inc.

Notification Switch

Would you like to follow the 'Introductory statistics' conversation and receive update notifications?

Ask