

| << Chapter < Page | Chapter >> Page > |
Statistics students believe that the mean score on the first statistics test is 65. A statistics instructor thinks the mean score is higher than 65. He samples ten statistics students and obtains the scores
Set up the hypothesis test:
A 5% level of significance means that α = 0.05. This is a test of a single population mean .
H 0 : μ = 65 H a : μ >65
Since the instructor thinks the average score is higher, use a ">". The ">" means the test is right-tailed.
Determine the distribution needed:
Random variable: = average score on the first statistics test.
Distribution for the test: If you read the problem carefully, you will notice that there is no population standard deviation given . You are only given n = 10 sample data values. Notice also that the data come from a normal distribution. This means that the distribution for the test is a student's t .
Use t df . Therefore, the distribution for the test is t 9 where n = 10 and df = 10 - 1 = 9.
Calculate the p -value using the Student's t -distribution:
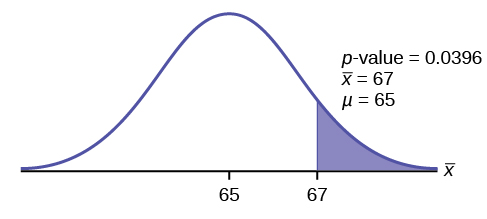
p -value = P ( >67) = 0.0396 where the sample mean and sample standard deviation are calculated as 67 and 3.1972 from the data.
Interpretation of the p -value: If the null hypothesis is true, then there is a 0.0396 probability (3.96%) that the sample mean is 65 or more.
Compare α and the p -value:
Since α = 0.05 and p -value = 0.0396. α > p -value.
Make a decision: Since α > p -value, reject H 0 .
This means you reject μ = 65. In other words, you believe the average test score is more than 65.
Conclusion: At a 5% level of significance, the sample data show sufficient evidence that the mean (average) test score is more than 65, just as the math instructor thinks.
The p -value can easily be calculated.
Put the data into a list. Press
STAT and arrow over to
TESTS . Press
2:T-Test . Arrow over to
Data and press
ENTER . Arrow down and enter 65 for
μ
0 , the name of the list where you put the data, and 1 for
Freq: . Arrow down to
μ : and arrow over to>
μ
0 . Press
ENTER . Arrow down to
Calculate and press
ENTER . The calculator not only calculates the
p -value (
p = 0.0396) but it also calculates the test statistic (
t -score) for the sample mean, the sample mean, and the sample standard deviation.
μ >65 is the alternative hypothesis. Do this set of instructions again except arrow to
Draw (instead of
Calculate ). Press
ENTER . A shaded graph appears with
t = 1.9781 (test statistic) and
p = 0.0396 (
p -value). Make sure when you use
Draw that no other equations are highlighted in
Y = and the plots are turned off.
It is believed that a stock price for a particular company will grow at a rate of $5 per week with a standard deviation of $1. An investor believes the stock won’t grow as quickly. The changes in stock price is recorded for ten weeks and are as follows: $4, $3, $2, $3, $1, $7, $2, $1, $1, $2. Perform a hypothesis test using a 5% level of significance. State the null and alternative hypotheses, find the p -value, state your conclusion, and identify the Type I and Type II errors.
H 0 : μ = 5
H a : μ <5
p = 0.0082
Because p < α , we reject the null hypothesis. There is sufficient evidence to suggest that the stock price of the company grows at a rate less than $5 a week.
Type I Error: To conclude that the stock price is growing slower than $5 a week when, in fact, the stock price is growing at $5 a week (reject the null hypothesis when the null hypothesis is true).
Type II Error: To conclude that the stock price is growing at a rate of $5 a week when, in fact, the stock price is growing slower than $5 a week (do not reject the null hypothesis when the null hypothesis is false).
Notification Switch
Would you like to follow the 'Introductory statistics' conversation and receive update notifications?

|
|
|
|
|

|
|

|
|

|
|

|
|

|
|

|
|

|
|

|
|

|
|

|