The student will calculate the 90% confidence interval the proportion of students in this school who were born in this state.
The student will interpret confidence intervals.
The student will determine the effects of changing conditions on the confidence interval.
Collect the data
Survey the students in your class, asking them if they were born in this state. Let
X = the number that were born in this state.
n = ____________
x = ____________
In words, define the random variable
P′ .
State the estimated distribution to use.
Find the confidence interval and error bound
Calculate the confidence interval and the error bound.
Confidence Interval: _____
Error Bound: _____
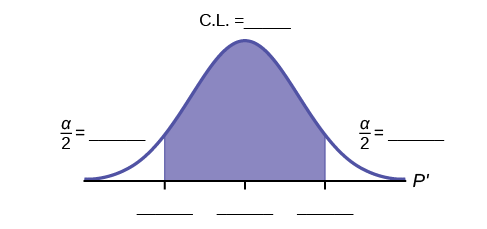
How much area is in both tails (combined)? α = _____
How much area is in each tail?
= _____
Fill in the blanks on the graph with the area in each section. Then, fill in the number line with the upper and lower limits of the confidence interval and the sample proportion.
Describe the confidence interval
In two to three complete sentences, explain what a confidence interval means (in general), as though you were talking to someone who has not taken statistics.
In one to two complete sentences, explain what this confidence interval means for this particular study.
Construct a confidence interval for each confidence level given.
Confidence level
EBP/Error Bound
Confidence Interval
50%
80%
95%
99%
What happens to the EBP as the confidence level increases? Does the width of the confidence interval increase or decrease? Explain why this happens.
Step 1: Find the mean. To find the mean, add up all the scores, then divide them by the number of scores. ...
Step 2: Find each score's deviation from the mean. ...
Step 3: Square each deviation from the mean. ...
Step 4: Find the sum of squares. ...
Step 5: Divide the sum of squares by n – 1 or N.
The sample of 16 students is taken. The average age in the sample was 22 years with astandard deviation of 6 years. Construct a 95% confidence interval for the age of the population.
Bhartdarshan' is an internet-based travel agency wherein customer can see videos of the cities they plant to visit. The number of hits daily is a normally distributed random variable with a mean of 10,000 and a standard deviation of 2,400
a. what is the probability of getting more than 12,000 hits?
b. what is the probability of getting fewer than 9,000 hits?
Bhartdarshan'is an internet-based travel agency wherein customer can see videos of the cities they plan to visit. The number of hits daily is a normally distributed random variable with a mean of 10,000 and a standard deviation of 2,400.
a. What is the probability of getting more than 12,000 hits