The student will calculate the 90% confidence interval for the mean cost of a home in the area in which this school is located.
The student will interpret confidence intervals.
The student will determine the effects of changing conditions on the confidence interval.
Collect the data
Check the Real Estate section in your local newspaper. Record the sale prices for 35 randomly selected homes recently listed in the county.
Note
Many newspapers list them only one day per week. Also, we will assume that homes come up for sale randomly.
Complete the table:
__________
__________
__________
__________
__________
__________
__________
__________
__________
__________
__________
__________
__________
__________
__________
__________
__________
__________
__________
__________
__________
__________
__________
__________
__________
__________
__________
__________
__________
__________
__________
__________
__________
__________
__________
Describe the data
Compute the following:
= _____
= _____
n = _____
In words, define the random variable
.
State the estimated distribution to use. Use both words and symbols.
Find the confidence interval
Calculate the confidence interval and the error bound.
Confidence Interval: _____
Error Bound: _____
How much area is in both tails (combined)?
α = _____
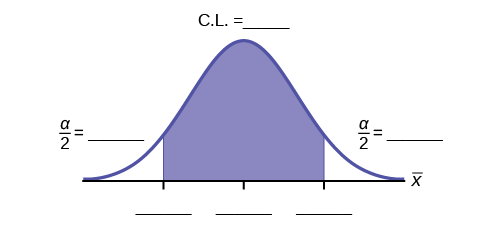
How much area is in each tail?
= _____
Fill in the blanks on the graph with the area in each section. Then, fill in the number
line with the upper and lower limits of the confidence interval and the sample mean.
Some students think that a 90% confidence interval contains 90% of the data. Use the list of data on the first page and count how many of the data values lie within the confidence interval. What percent is this? Is this percent close to 90%? Explain why this percent should or should not be close to 90%.
Describe the confidence interval
In two to three complete sentences, explain what a confidence interval means (in general), as if you were talking to someone who has not taken statistics.
In one to two complete sentences, explain what this confidence interval means for this particular study.
Use the data to construct confidence intervals
Using the given information, construct a confidence interval for each confidence level given.
Confidence level
EBM/Error Bound
Confidence Interval
50%
80%
95%
99%
What happens to the EBM as the confidence level increases? Does the width of the confidence interval increase or decrease? Explain why this happens.
Step 1: Find the mean. To find the mean, add up all the scores, then divide them by the number of scores. ...
Step 2: Find each score's deviation from the mean. ...
Step 3: Square each deviation from the mean. ...
Step 4: Find the sum of squares. ...
Step 5: Divide the sum of squares by n – 1 or N.
The sample of 16 students is taken. The average age in the sample was 22 years with astandard deviation of 6 years. Construct a 95% confidence interval for the age of the population.
Bhartdarshan' is an internet-based travel agency wherein customer can see videos of the cities they plant to visit. The number of hits daily is a normally distributed random variable with a mean of 10,000 and a standard deviation of 2,400
a. what is the probability of getting more than 12,000 hits?
b. what is the probability of getting fewer than 9,000 hits?
Bhartdarshan'is an internet-based travel agency wherein customer can see videos of the cities they plan to visit. The number of hits daily is a normally distributed random variable with a mean of 10,000 and a standard deviation of 2,400.
a. What is the probability of getting more than 12,000 hits