

| << Chapter < Page | Chapter >> Page > |
Find the 90th percentile for the total of 75 stress scores. Draw a graph.
Let = the 90th percentile.
Find where .
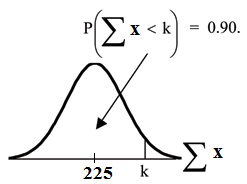
The 90th percentile for the sum of 75 scores is about 237.8. This tells us that 90% of all the sums of 75 scores are no more than 237.8 and 10% are no less than 237.8.
invNorm
Suppose that a market research analyst for a cell phone company conducts a study of their customers who exceed the time allowance included on their basic cell phone contract; the analyst finds that for those people who exceed the time included in their basic contract, the excess time used follows an exponential distribution with a mean of 22 minutes.
Consider a random sample of 80 customers who exceed the time allowance included in their basic cell phone contract.
Let = the excess time used by one INDIVIDUAL cell phone customer who exceeds his contracted time allowance.
~ From Chapter 5, we know that and .
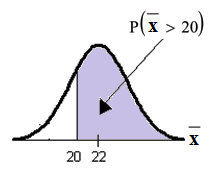
Let = the mean excess time used by a sample of customers who exceed their contracted time allowance.
~ by the CLT for Sample Means
using
normalcdf
The probability is 0.7919 that the mean excess time used is morethan 20 minutes, for a sample of 80 customers who exceed their contracted time allowance.
EE key for E. Or just use 10^99 instead of 1E99.
P(X>20) = e^(–(1/22)*20) or e^(–.04545*20) = 0.4029
Let = the 95th percentile. Find where
using
invNorm
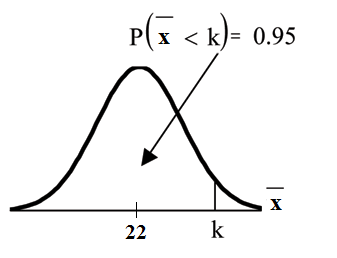
The 95th percentile for the sample mean excess time used is about 26.0 minutes for random samples of 80 customers who exceed their contractual allowed time.
95% of such samples would have means under 26 minutes; only 5% of such samples would have means above 26 minutes.
Notification Switch
Would you like to follow the 'Collaborative statistics' conversation and receive update notifications?

|
|

|
|

|
|

|
|

|
|

|
|
|
|
|

|
|

|
|
|
|