<< Chapter < Page Chapter >> Page >

Suppose X is a random variable with a distribution that may be known or unknown (it can be any distribution). Using a subscript that matches the random variable, suppose:

  • μ X = the mean of X
  • σ X = the standard deviation of X
If you draw random samples of size n , then as n increases, the random variable X which consists of sample means, tends to be normally distributed and

X ~ N ( μ X , σ X n )

The Central Limit Theorem for Sample Means says that if you keep drawing larger and larger samples (like rolling 1, 2, 5, and, finally, 10 dice) and calculating their means the sample means form their own normal distribution (the sampling distribution). The normal distribution has the same mean as the original distribution and a variance that equals the original variance divided by n , the sample size. n is the number of values that are averaged together not the number of times the experiment is done.

To put it more formally, if you draw random samples of size n ,the distribution of the random variable X , which consists of sample means, is called the sampling distribution of the mean . The sampling distribution of the mean approaches a normal distribution as n , the sample size, increases.

The random variable X has a different z-score associated with it than the random variable X . x is the value of X in one sample.

z = x - μ X ( σ X n )

μ X is both the average of X and of X .

σ X = σ X n = standard deviation of X and is called the standard error of the mean.

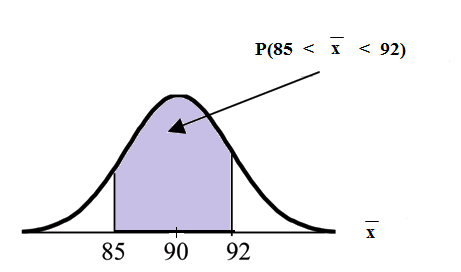
An unknown distribution has a mean of 90 and a standard deviation of 15. Samples of size n = 25 are drawn randomly from the population.

Find the probability that the sample mean is between 85 and 92.

Let X = one value from the original unknown population. The probability question asks you to find a probability for the sample mean .

Let X = the mean of a sample of size 25. Since μ X = 90 , σ X = 15 , and n = 25 ;

then X ~ N ( 90 , 15 25 )

Find P ( 85 x 92 ) Draw a graph.

P ( 85 x 92 ) = 0.6997

The probability that the sample mean is between 85 and 92 is 0.6997.

Normal distribution curve from -∞ to ∞ and an x-axis with the values of 85, 90, and 92. The x-axis is equal to the mean of a sample size of 25. A vertical upward line extends from points 85 and 92 to the curve. The probability area is between 85 and 92.

TI-83 or 84: normalcdf (lower value, upper value, mean, standard error of the mean)

The parameter list is abbreviated (lower value, upper value, μ , σ n )

normalcdf (85,92,90, 15 25 ) = 0.6997

Got questions? Get instant answers now!

Find the value that is 2 standard deviations above the expected value (it is 90) of the sample mean.

To find the value that is 2 standard deviations above the expected value 90, use the formula

value = μ X + (#ofSTDEVs) ( σ X n )

value = 90 + 2 15 25 = 96

So, the value that is 2 standard deviations above the expected value is 96.

Got questions? Get instant answers now!

The length of time, in hours, it takes an "over 40" group of people to play one soccer match is normally distributed with a mean of 2 hours and a standard deviation of 0.5 hours . A sample of size n = 50 is drawn randomly from the population.

Find the probability that the sample mean is between 1.8 hours and 2.3 hours.

Let X = the time, in hours, it takes to play one soccer match.

The probability question asks you to find a probability for the sample mean time, in hours , it takes to play one soccer match.

Let X = the mean time, in hours, it takes to play one soccer match.

If μ X = _________, σ X = __________, and n = ___________, then X ~ N (______, ______) by the Central Limit Theorem for Means.

μ X = 2 , σ X = 0.5 , n = 50 , and X ~ N ( 2 , 0.5 50 )

Find P ( 1.8 x 2.3 ) . Draw a graph.

P ( 1.8 x 2.3 ) = 0.9977

normalcdf (1.8,2.3,2, .5 50 ) = 0.9977

The probability that the mean time is between 1.8 hours and 2.3 hours is ______.

Got questions? Get instant answers now!

Questions & Answers

differentiate between demand and supply giving examples
Lambiv Reply
differentiated between demand and supply using examples
Lambiv
what is labour ?
Lambiv
how will I do?
Venny Reply
how is the graph works?I don't fully understand
Rezat Reply
information
Eliyee
devaluation
Eliyee
t
WARKISA
hi guys good evening to all
Lambiv
multiple choice question
Aster Reply
appreciation
Eliyee
explain perfect market
Lindiwe Reply
In economics, a perfect market refers to a theoretical construct where all participants have perfect information, goods are homogenous, there are no barriers to entry or exit, and prices are determined solely by supply and demand. It's an idealized model used for analysis,
Ezea
What is ceteris paribus?
Shukri Reply
other things being equal
AI-Robot
When MP₁ becomes negative, TP start to decline. Extuples Suppose that the short-run production function of certain cut-flower firm is given by: Q=4KL-0.6K2 - 0.112 • Where is quantity of cut flower produced, I is labour input and K is fixed capital input (K-5). Determine the average product of lab
Kelo
Extuples Suppose that the short-run production function of certain cut-flower firm is given by: Q=4KL-0.6K2 - 0.112 • Where is quantity of cut flower produced, I is labour input and K is fixed capital input (K-5). Determine the average product of labour (APL) and marginal product of labour (MPL)
Kelo
yes,thank you
Shukri
Can I ask you other question?
Shukri
what is monopoly mean?
Habtamu Reply
What is different between quantity demand and demand?
Shukri Reply
Quantity demanded refers to the specific amount of a good or service that consumers are willing and able to purchase at a give price and within a specific time period. Demand, on the other hand, is a broader concept that encompasses the entire relationship between price and quantity demanded
Ezea
ok
Shukri
how do you save a country economic situation when it's falling apart
Lilia Reply
what is the difference between economic growth and development
Fiker Reply
Economic growth as an increase in the production and consumption of goods and services within an economy.but Economic development as a broader concept that encompasses not only economic growth but also social & human well being.
Shukri
production function means
Jabir
What do you think is more important to focus on when considering inequality ?
Abdisa Reply
any question about economics?
Awais Reply
sir...I just want to ask one question... Define the term contract curve? if you are free please help me to find this answer 🙏
Asui
it is a curve that we get after connecting the pareto optimal combinations of two consumers after their mutually beneficial trade offs
Awais
thank you so much 👍 sir
Asui
In economics, the contract curve refers to the set of points in an Edgeworth box diagram where both parties involved in a trade cannot be made better off without making one of them worse off. It represents the Pareto efficient allocations of goods between two individuals or entities, where neither p
Cornelius
In economics, the contract curve refers to the set of points in an Edgeworth box diagram where both parties involved in a trade cannot be made better off without making one of them worse off. It represents the Pareto efficient allocations of goods between two individuals or entities,
Cornelius
Suppose a consumer consuming two commodities X and Y has The following utility function u=X0.4 Y0.6. If the price of the X and Y are 2 and 3 respectively and income Constraint is birr 50. A,Calculate quantities of x and y which maximize utility. B,Calculate value of Lagrange multiplier. C,Calculate quantities of X and Y consumed with a given price. D,alculate optimum level of output .
Feyisa Reply
Answer
Feyisa
c
Jabir
the market for lemon has 10 potential consumers, each having an individual demand curve p=101-10Qi, where p is price in dollar's per cup and Qi is the number of cups demanded per week by the i th consumer.Find the market demand curve using algebra. Draw an individual demand curve and the market dema
Gsbwnw Reply
suppose the production function is given by ( L, K)=L¼K¾.assuming capital is fixed find APL and MPL. consider the following short run production function:Q=6L²-0.4L³ a) find the value of L that maximizes output b)find the value of L that maximizes marginal product
Abdureman
types of unemployment
Yomi Reply
What is the difference between perfect competition and monopolistic competition?
Mohammed
Got questions? Join the online conversation and get instant answers!
Jobilize.com Reply
Practice Key Terms 4

Get Jobilize Job Search Mobile App in your pocket Now!

Get it on Google Play Download on the App Store Now


Source:  OpenStax, Collaborative statistics. OpenStax CNX. Jul 03, 2012 Download for free at http://cnx.org/content/col10522/1.40
Google Play and the Google Play logo are trademarks of Google Inc.

Notification Switch

Would you like to follow the 'Collaborative statistics' conversation and receive update notifications?

Ask