<< Chapter < Page Chapter >> Page >

Try it

Use the information in [link] to answer the following questions.

  1. Find the 30 th percentile, and interpret it in a complete sentence.
  2. What is the probability that the age of a randomly selected smartphone user in the range 13 to 55+ is less than 27 years old.

Let X = a smart phone user whose age is 13 to 55+. X ~ N (36.9, 13.9)

  1. To find the 30 th percentile, find k such that P ( x < k ) = 0.30.
    invNorm(0.30, 36.9, 13.9) = 29.6 years
    Thirty percent of smartphone users 13 to 55+ are at most 29.6 years and 70% are at least 29.6 years.
  2. Find P ( x <27)
    This is a normal distribution curve. The peak of the curve coincides with the point 36.9 on the horizontal axis. The point 27 is also labeled. A vertical line extends from 27 to the curve. The area under the curve to the left of 27 is shaded. The shaded area shows that P(x < 27) = 0.2342.

    normalcdf(0,27,36.9,13.9) = 0.2342
    (Note that normalcdf(–10 99 ,27,36.9,13.9) = 0.2382. The two answers differ only by 0.0040.)
Got questions? Get instant answers now!

There are approximately one billion smartphone users in the world today. In the United States the ages 13 to 55+ of smartphone users approximately follow a normal distribution with approximate mean and standard deviation of 36.9 years and 13.9 years respectively. Using this information, answer the following questions (round answers to one decimal place).

a. Calculate the interquartile range ( IQR ).

a.

  • IQR = Q 3 Q 1
  • Calculate Q 3 = 75 th percentile and Q 1 = 25 th percentile.
  • invNorm(0.75,36.9,13.9) = Q 3 = 46.2754
  • invNorm(0.25,36.9,13.9) = Q 1 = 27.5246
  • IQR = Q 3 Q 1 = 18.7508

Got questions? Get instant answers now!

b. Forty percent of the ages that range from 13 to 55+ are at least what age?

b.

  • Find k where P ( x > k ) = 0.40 ("At least" translates to "greater than or equal to.")
  • 0.40 = the area to the right.
  • Area to the left = 1 – 0.40 = 0.60.
  • The area to the left of k = 0.60.
  • invNorm(0.60,36.9,13.9) = 40.4215.
  • k = 40.42.
  • Forty percent of the ages that range from 13 to 55+ are at least 40.42 years.

Got questions? Get instant answers now!

Try it

Two thousand students took an exam. The scores on the exam have an approximate normal distribution with a mean μ = 81 points and standard deviation σ = 15 points.

  1. Calculate the first- and third-quartile scores for this exam.
  2. The middle 50% of the exam scores are between what two values?
  1. Q 1 = 25 th percentile = invNorm(0.25,81,15) = 70.9
    Q 3 = 75 th percentile = invNorm(0.75,81,15) = 91.9
  2. The middle 50% of the scores are between 70.9 and 91.1.
Got questions? Get instant answers now!

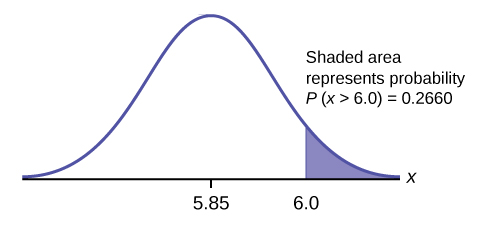
A citrus farmer who grows mandarin oranges finds that the diameters of mandarin oranges harvested on his farm follow a normal distribution with a mean diameter of 5.85 cm and a standard deviation of 0.24 cm.

a. Find the probability that a randomly selected mandarin orange from this farm has a diameter larger than 6.0 cm. Sketch the graph.

a. normalcdf(6,10^99,5.85,0.24) = 0.2660

This is a normal distribution curve. The peak of the curve coincides with the point 2 on the horizontal axis. The values 1.8 and 2.75 are also labeled on the x-axis. Vertical lines extend from 1.8 and 2.75 to the curve. The area between the lines is shaded.
Got questions? Get instant answers now!

b. The middle 20% of mandarin oranges from this farm have diameters between ______ and ______.

b.

  • 1 – 0.20 = 0.80
  • The tails of the graph of the normal distribution each have an area of 0.40.
  • Find k1 , the 40 th percentile, and k2 , the 60 th percentile (0.40 + 0.20 = 0.60).
  • k1 = invNorm(0.40,5.85,0.24) = 5.79 cm
  • k2 = invNorm(0.60,5.85,0.24) = 5.91 cm

Got questions? Get instant answers now!

c. Find the 90 th percentile for the diameters of mandarin oranges, and interpret it in a complete sentence.

c. 6.16: Ninety percent of the diameter of the mandarin oranges is at most 6.15 cm.

Got questions? Get instant answers now!

Try it

Using the information from [link] , answer the following:

  1. The middle 45% of mandarin oranges from this farm are between ______ and ______.
  2. Find the 16 th percentile and interpret it in a complete sentence.
  1. The middle area = 0.40, so each tail has an area of 0.30.

    1 – 0.40 = 0.60

    The tails of the graph of the normal distribution each have an area of 0.30.

    Find k1 , the 30 th percentile and k2 , the 70 th percentile (0.40 + 0.30 = 0.70).

    k1 = invNorm(0.30,5.85,0.24) = 5.72 cm

    k2 = invNorm(0.70,5.85,0.24) = 5.98 cm

  2. normalcdf(5,1099,5.85,0.24) = 0.9998
Got questions? Get instant answers now!

Get Jobilize Job Search Mobile App in your pocket Now!

Get it on Google Play Download on the App Store Now


Source:  OpenStax, Introductory statistics. OpenStax CNX. May 06, 2016 Download for free at http://legacy.cnx.org/content/col11562/1.18
Google Play and the Google Play logo are trademarks of Google Inc.

Notification Switch

Would you like to follow the 'Introductory statistics' conversation and receive update notifications?

Ask